Admin console
A full tour of the MaelGard admin console, screen by screen, for tenant admins, security admins, DPOs, analysts, device operators and auditors.
The MaelGard console shows what devices report: metadata only, never the text of prompts. It is used to monitor the use of generative AI services, pilot the policy and run governance actions (re-identification, audit, exports).
The screenshots on this page come from the local test environment, with synthetic data and placeholder identifiers. The ergonomics and navigation are identical in production.
1. Principles
- The server is the source of truth. Menus and buttons follow your roles. A refused action shows: "You do not have the required permissions for this action."
- Nothing is made up. A missing value shows as "Not available" (a dash in tables).
0is a measurement, "Masked" protects a small group, "Not computable" flags a rate without a denominator. - People protection. People are pseudonymised by default. Groups smaller than k people (5 by default) are masked in views and exports.
- Two people for sensitive actions. A policy is published after another person reviews it. A re-identification is decided by someone other than the requester.
- Everything is traced. Sensitive actions are written to the audit log, with the reason given by the author.
2. Sign in
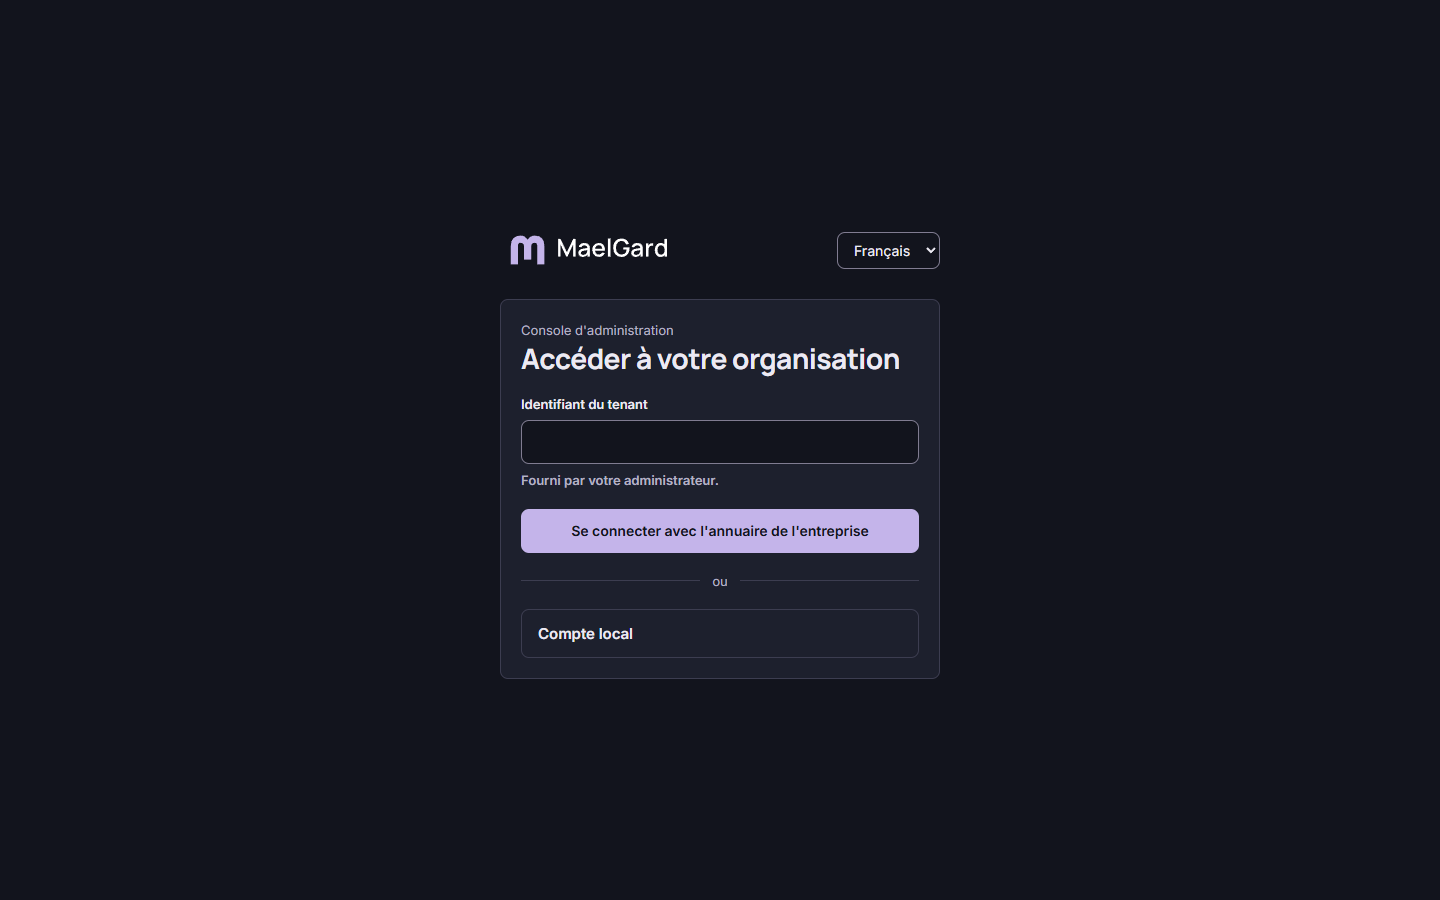
- Open the console URL provided by your administrator.
- Enter the tenant identifier of your organisation.
- Choose the identity provider: "Sign in with the enterprise directory" (Entra ID, Keycloak, strong authentication if required) or "Local account" (user name, password, 6-digit MFA code).
On failure, the message is deliberately the same regardless of the cause: "Sign-in failed. Check your credentials or contact your administrator." Password and code are cleared immediately.
During the session, the header shows the organisation identifier (with a "Copy" button), the language (French or English), the signed-in account and its roles, and the "Sign out" button.
3. Roles and screens
Roles come from directory groups (see Identity and access). A missing menu means your role does not grant access.
| Screen | Tenant admin | Security admin | DPO | Analyst | Device operator | Auditor |
|---|---|---|---|---|---|---|
| Dashboards | read | read | read | read | read | read |
| Alerts | — | handles | — | handles | read | read |
| Events | — | read | read | read | — | read |
| Policy | read | edits | edits (privacy) | read | read | read |
| Change review | read | reviews, publishes | reviews, publishes (privacy) | read | read | read |
| Catalog and models | read | edits | read | read, discoveries | read | read |
| Fleet | actions, groups | actions, groups, rings | read | read | actions | read |
| Rollouts | read | drives | read | read | read | read |
| Alert rules | edits | edits | — | read | — | read |
| Device enrolment | issues tokens | — | — | — | issues tokens | — |
| Re-identification | read | read | requests, decides | requests | — | read |
| Privacy | read | read | edits | read | read | read |
| Audit log | — | — | read | — | — | read |
| Compliance | read | — | read | — | — | read |
| Exports | — | — | requests | requests | — | — |
| Identity and access | edits | — | — | — | — | read (no secret) |
| Integrations | edits | read | — | — | — | read |
Re-identifications are decided by the approver role chosen in "Privacy" (DPO by default), never by the requester.
4. Common patterns
Navigation
The sidebar groups screens into four families: Analysis, Pilot, Privacy and compliance, Administration. Each screen has its own URL: a shared link reopens the same screen, including the tab.
Freshness
The "Refreshed at hh:mm:ss" line below the title gives the last load time. Screens do not auto-refresh: use "Refresh" to reload data.
Filters
Edit the fields, then click "Apply" or "Search". Until you do, "Filters changed, not yet applied" reminds you. Active filters appear as pills, each with a remove button. "Reset" returns to defaults.
Tables and charts
- Columns marked with a double arrow can be sorted. The sort applies to the displayed results, as noted below the table title.
- Wide tables scroll horizontally without hiding headers.
- Each chart has an equivalent data table: "Show data table" / "Show chart".
Dates and confirmations
- Dates are shown in local time with the timezone, for example "10/05/2026 10:34 UTC+2".
- Any effectful action first shows a summary: what changes, the effect and, if required, a reason written to the audit log.
- Irreversible actions ask you to retype a name or identifier. If the action fails, the error is shown in the confirmation dialog.
5. Analysis
5.1 Dashboards
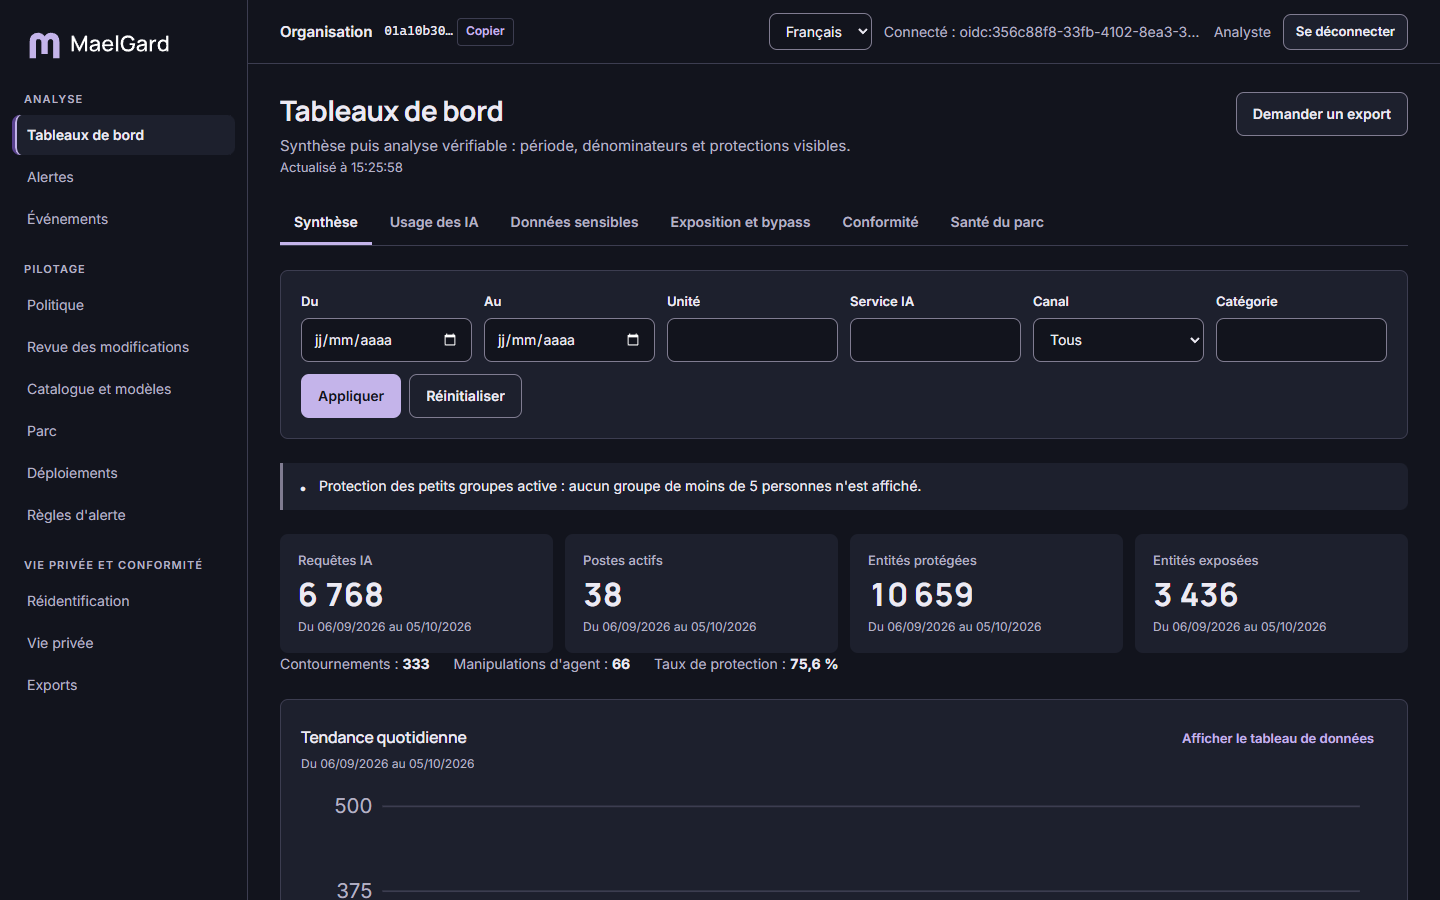
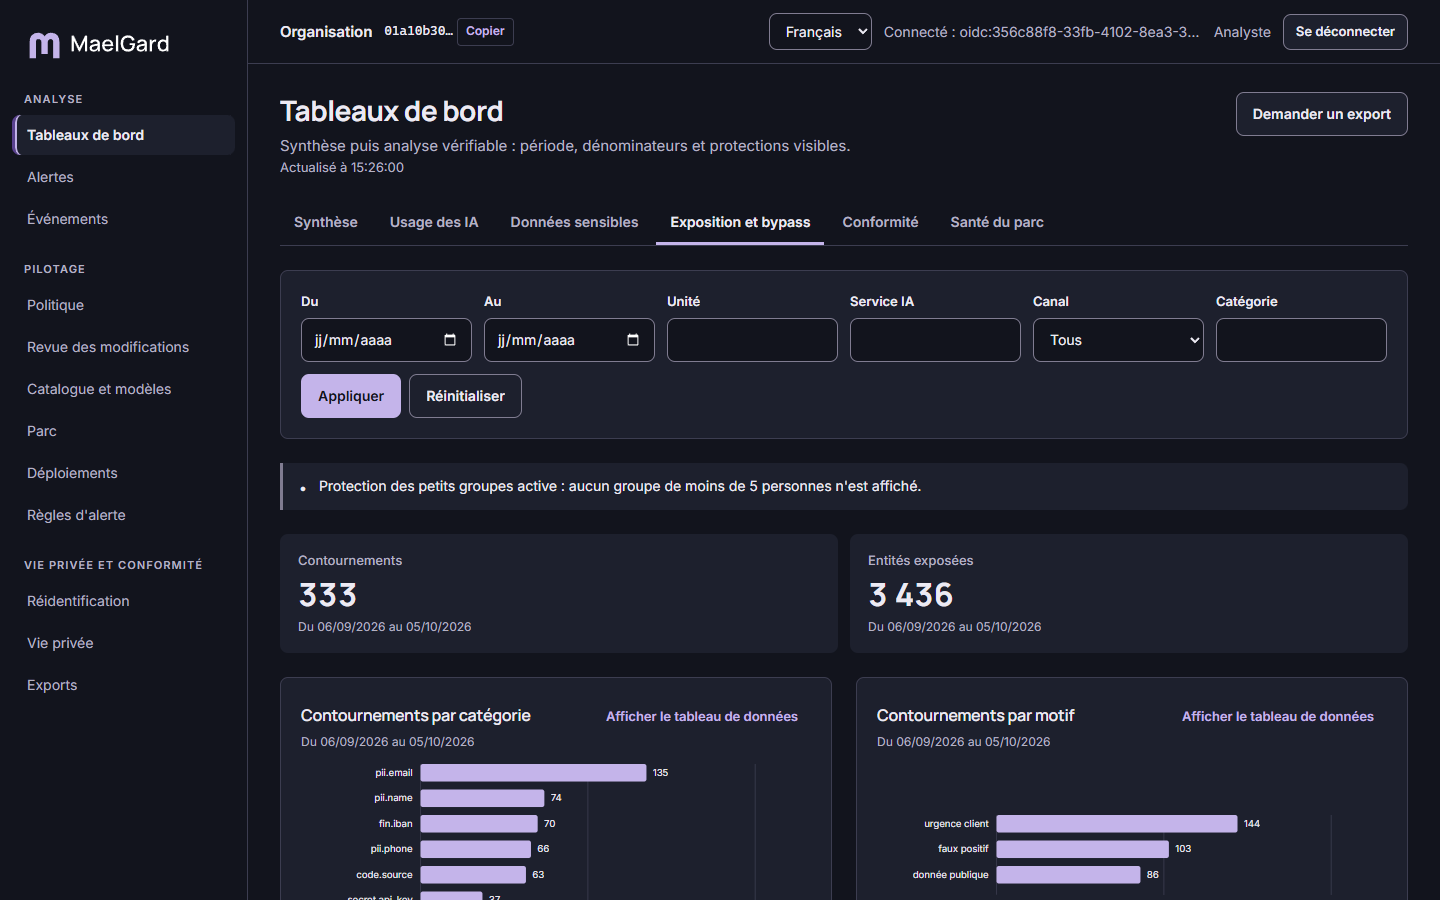
Six tabs give a complete picture of use and protection.
| View | Content |
|---|---|
| Summary | Key indicators and daily trend. The protection rate is the ratio of protected entities over detected entities over the period. |
| AI usage | Requests per service, per channel (web, desktop app, API, code tool) and per unit. |
| Sensitive data | Protected and exposed entities, per category and per service. |
| Exposure and bypass | Bypasses by reason, service, category and unit. In named mode, list of most-exposed people (analysts only, access traced). |
| Compliance | Technical fleet coverage, agent versions, active categories, policy per group. This is not a legal compliance assessment. |
| Fleet health | Silent devices, integrity alerts, analysis failures, uninspectable traffic, stale versions, revoked devices. |
- Filters: period (last 30 days by default), unit, AI service, channel, category.
- Small-group protection banner: shows how many groups were masked to protect people.
- Request export: produces the current view as CSV or PDF.
5.2 Alerts
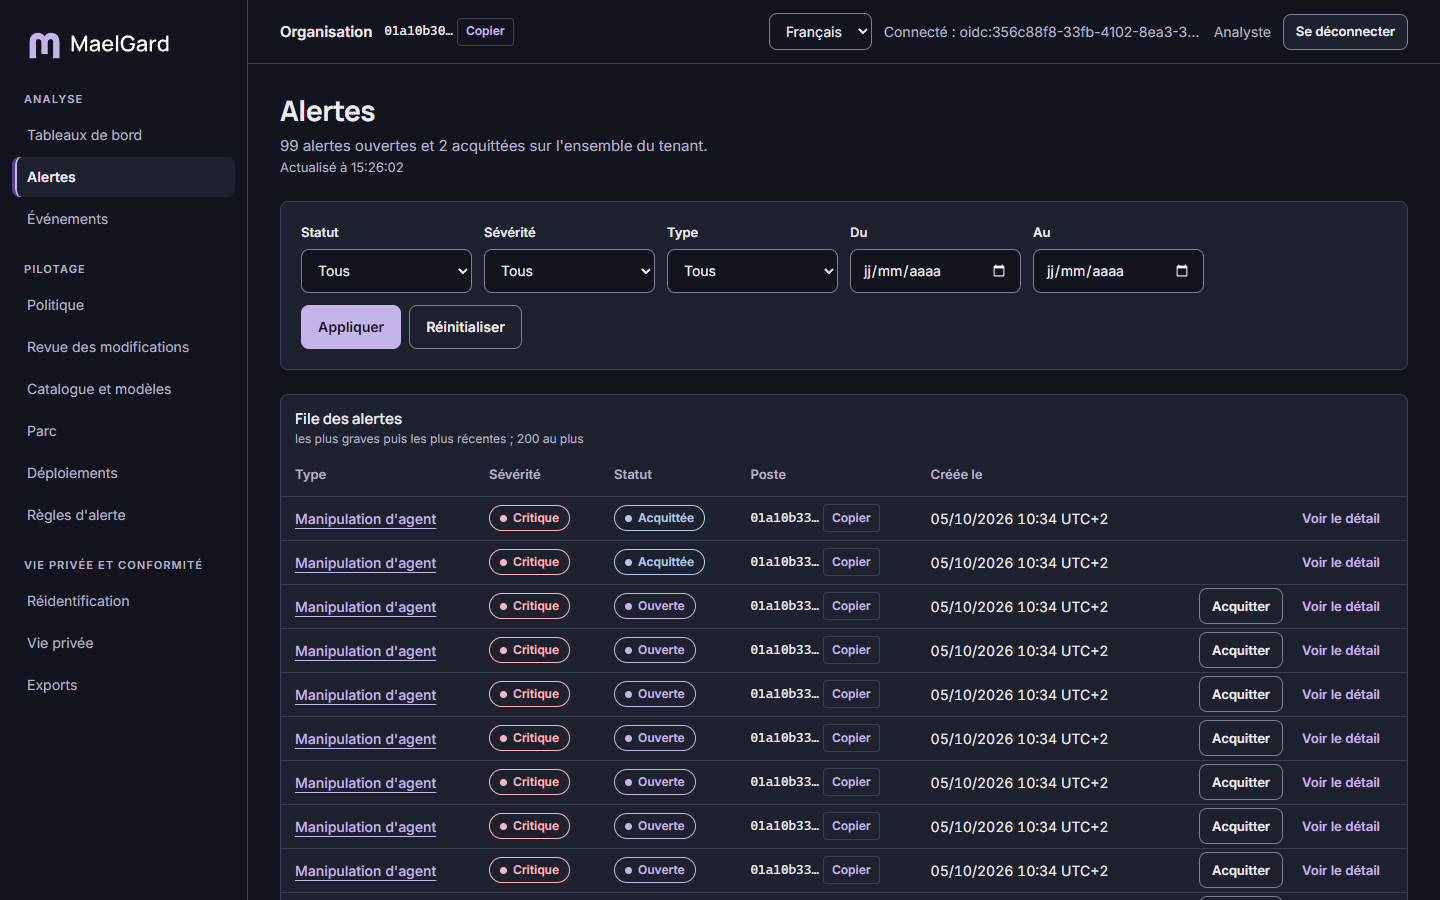
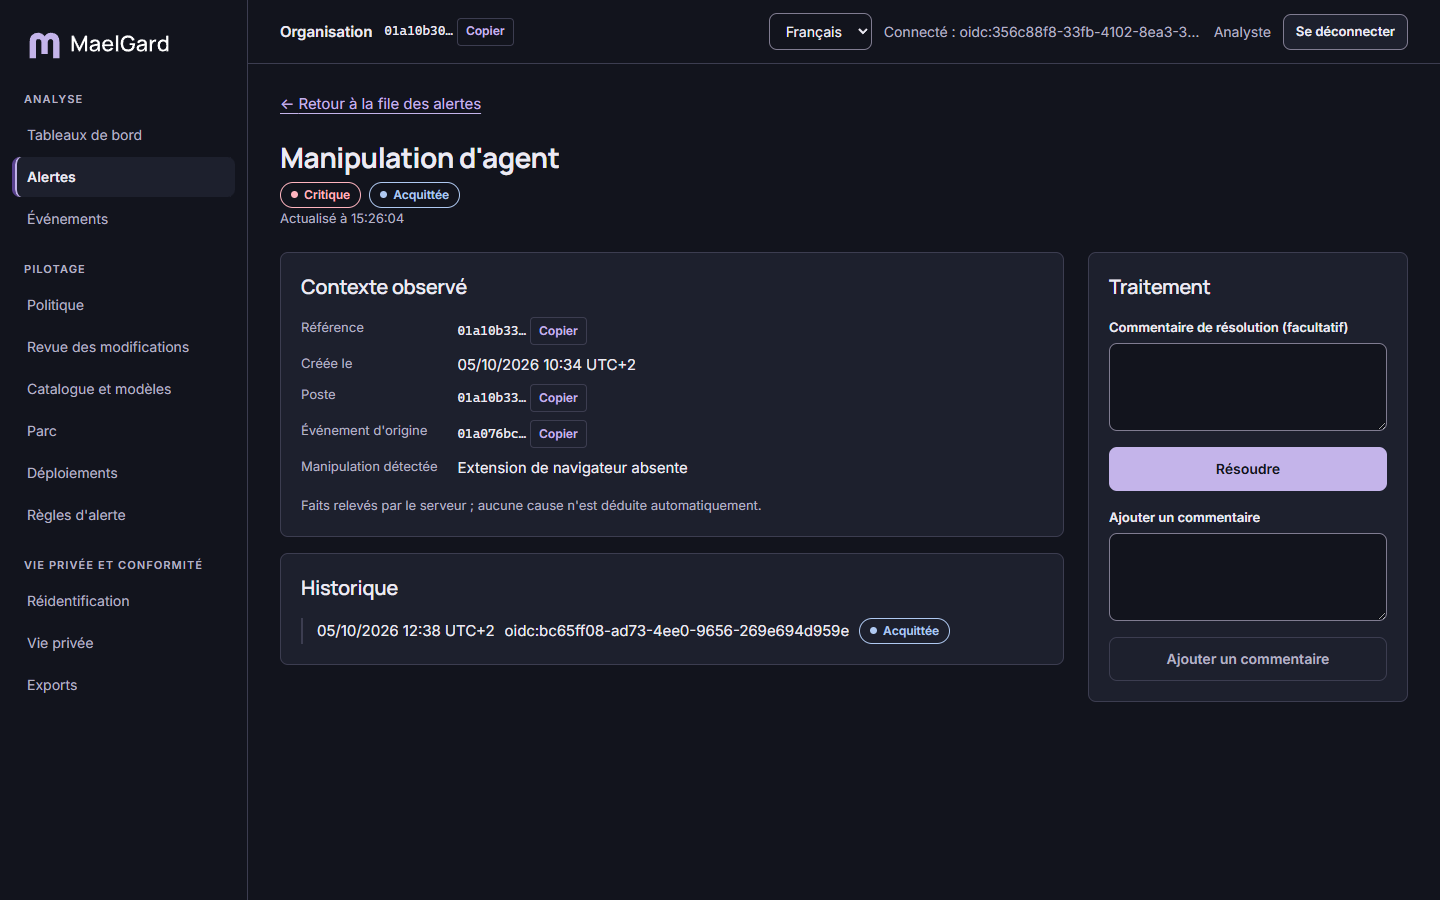
The queue shows the most serious alerts first, then the most recent, up to 200 entries. Counters at the top cover the whole tenant.
- Filters: status, severity (critical, high, medium, low), type, period.
- Alert types: devices (agent tampering, integrity breach, clock drift, silent device), usage (bypass spike, rise in unapproved services), fleet and rollouts, organisation (group removed from directory, vendor break-glass).
- Handle: "Acknowledge" marks the alert as taken into account, "Resolve" closes it with an optional resolution comment.
The alert detail shows the observed context (facts recorded by the server, no cause inferred automatically), the affected device, the change history and the comments. The absence of alerts does not guarantee the absence of risk: also check fleet health.
5.3 Events
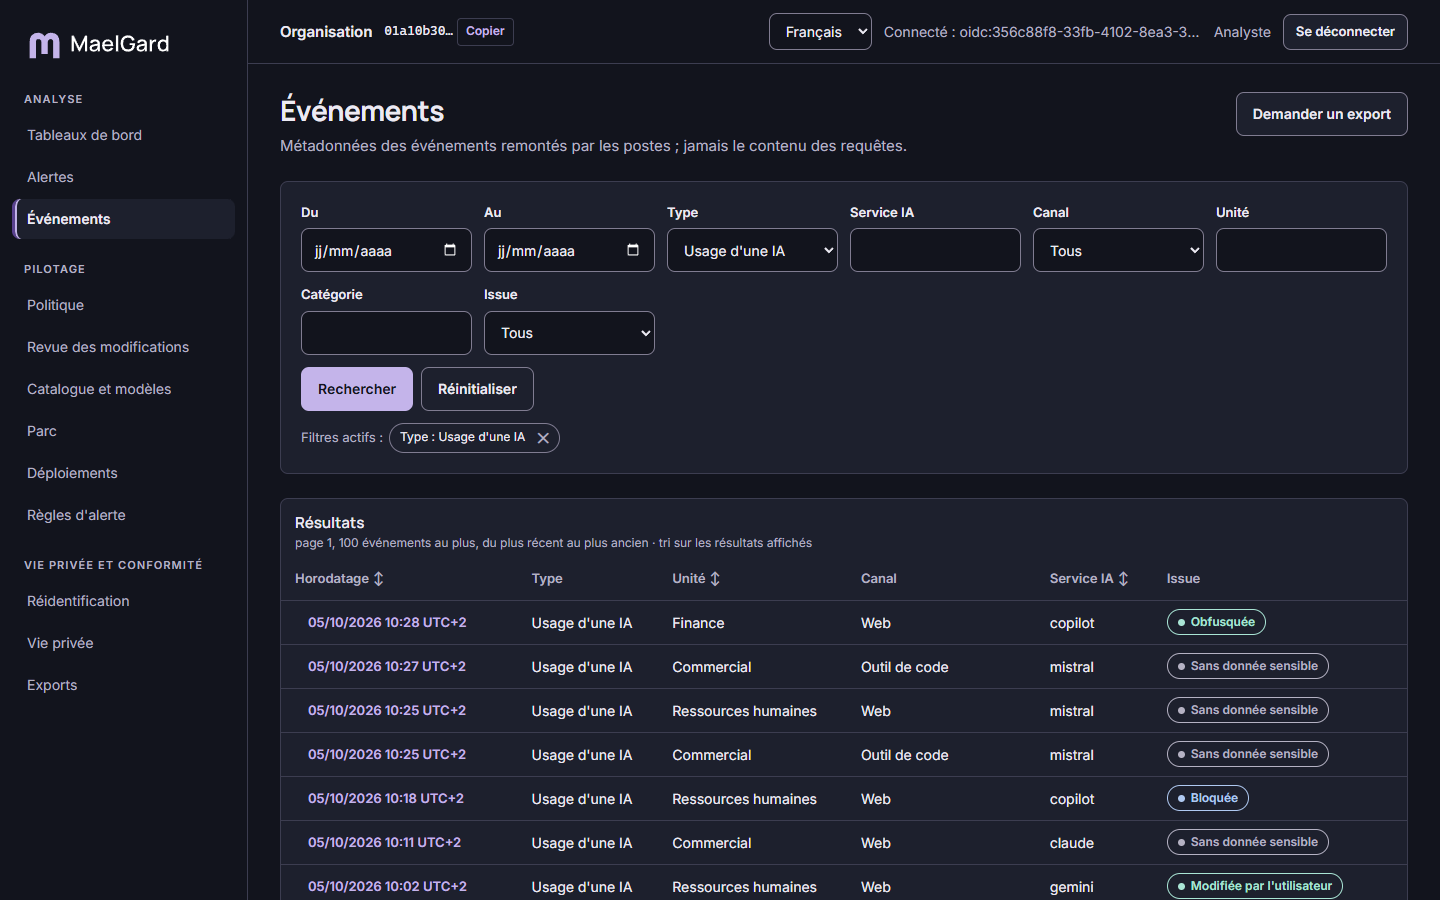
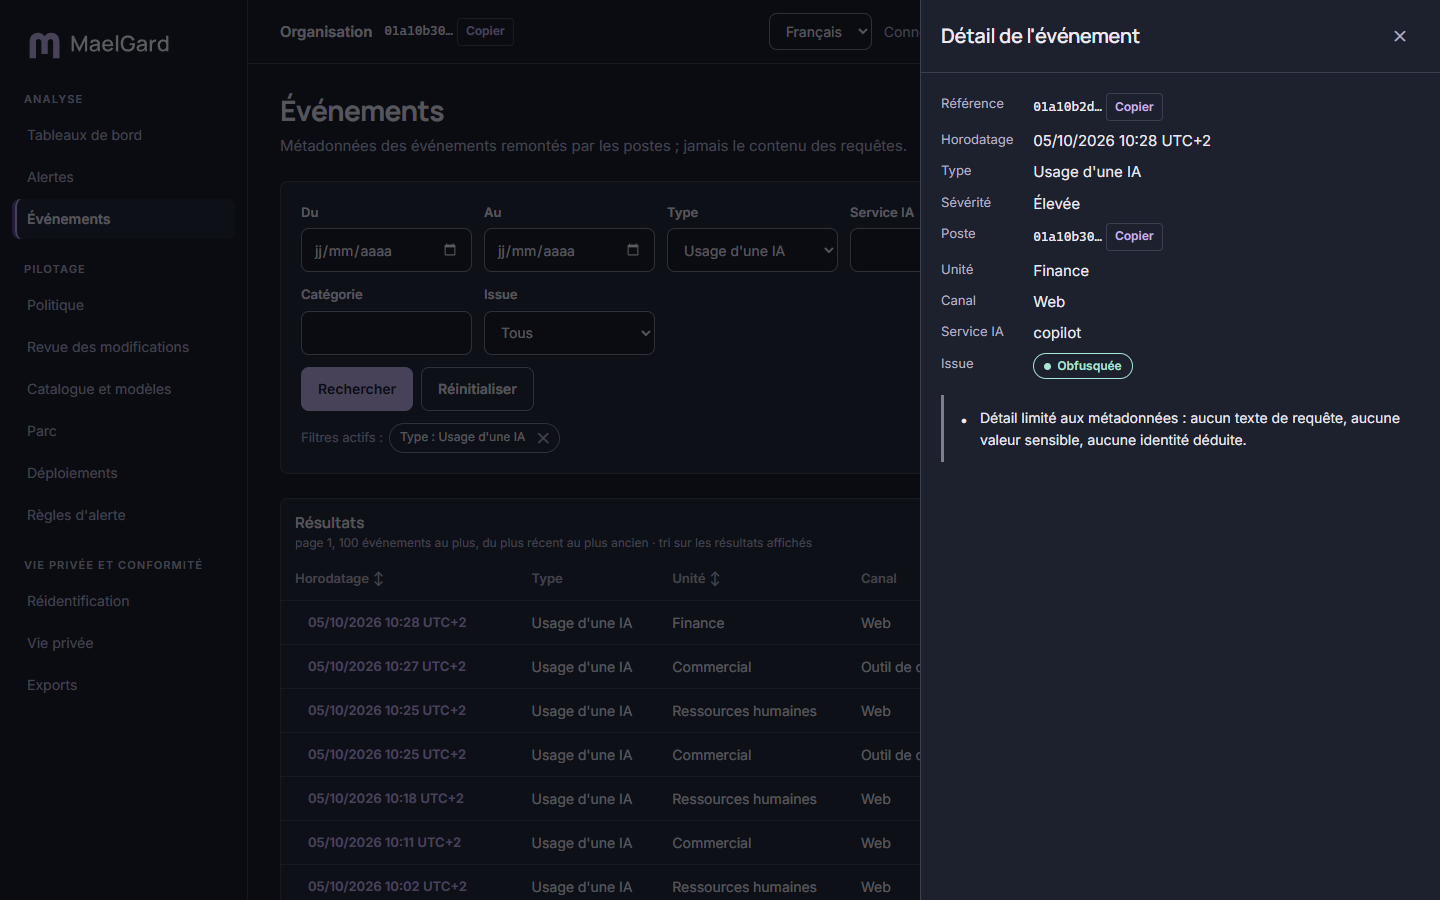
Search in the metadata of events reported by devices: type (AI usage, agent tampering), service, channel, unit, category, outcome and period. Outcomes are Allowed, Masked, User decides and Blocked. Results are paginated by 100, from most to least recent.
- Detail: clicking the timestamp opens a side panel. It contains only metadata: no prompt text, no sensitive value, no inferred identity.
- Small groups: an event's unit is masked when it has fewer than k people; the number of affected events on the page is shown.
- Access request: after an approved GDPR access request, "View these events" opens a search restricted to the person concerned. This access is traced.
6. Privacy and compliance
6.1 Re-identification
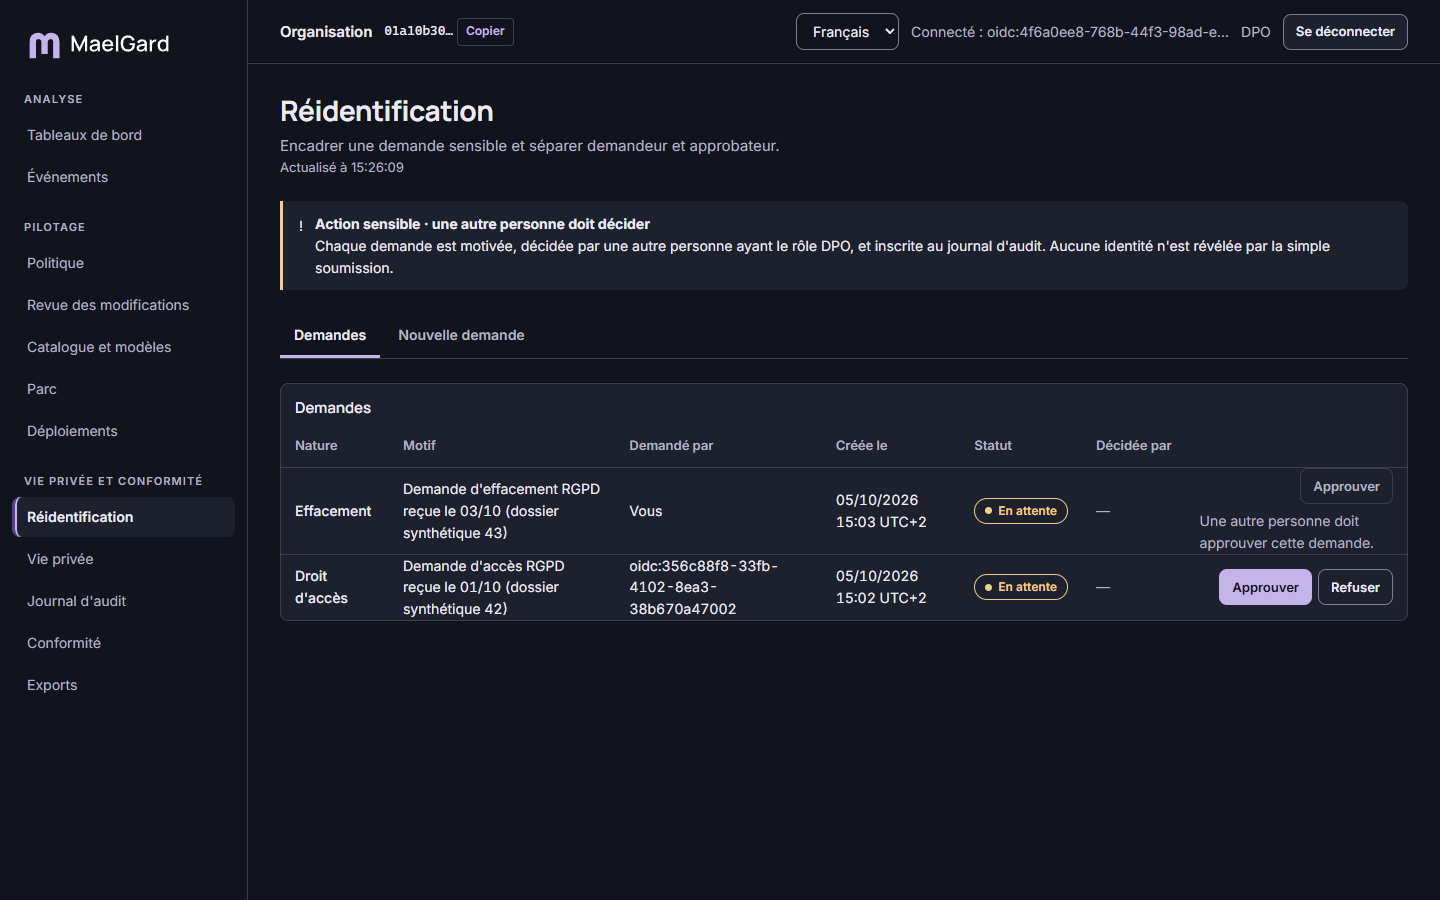
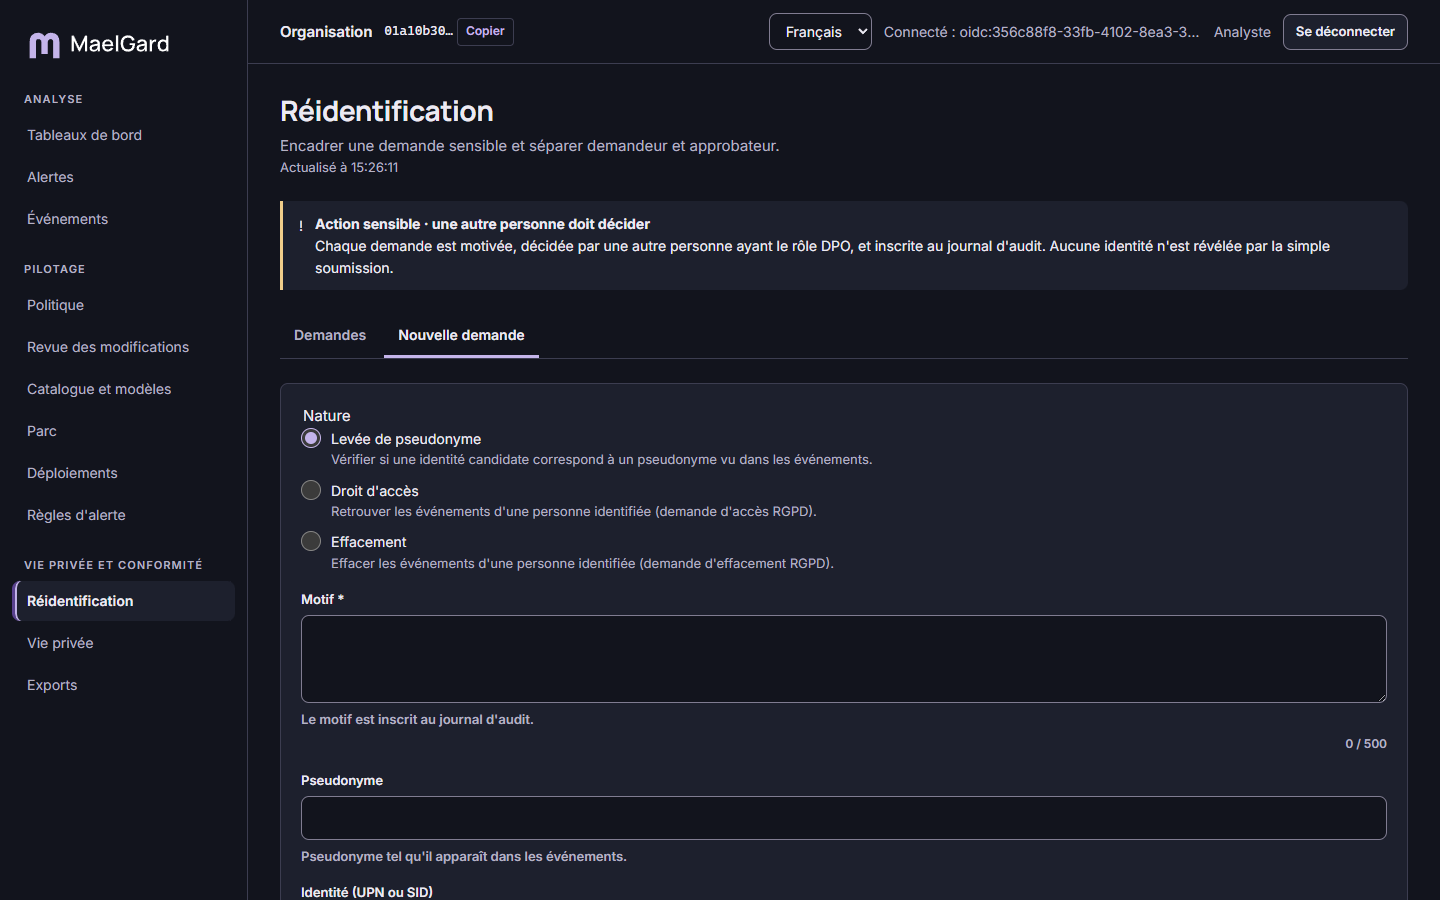
Re-identification lifts protection on a person for a precise need. It requires a motivated request, a decision by another person holding the approver role, and an entry in the audit log.
Request (analyst, DPO) from the "New request" tab:
- Choose the nature: Pseudonym lift (check if a candidate identity matches a pseudonym seen in events), Access right (retrieve the events of an identified person), Erasure (erase the events of an identified person).
- Fill in the identity (address or directory identifier), plus the pseudonym for a lift. The identity is encrypted and never displayed.
- Type the reason (at least 10 characters), then "Verify request" and "Send request".
Decide (approver role), "Requests" tab: "Approve" or "Reject", after reading the nature and reason. The requester can never decide their own request. An approved erasure is irreversible.
| Nature | Result |
|---|---|
| Pseudonym lift | "The candidate identity matches (or does not match) the pseudonym." |
| Access right | Number of events affected and a link to view them. |
| Erasure | Number of events erased. |
No identity is ever shown in clear, at any step.
6.2 Privacy
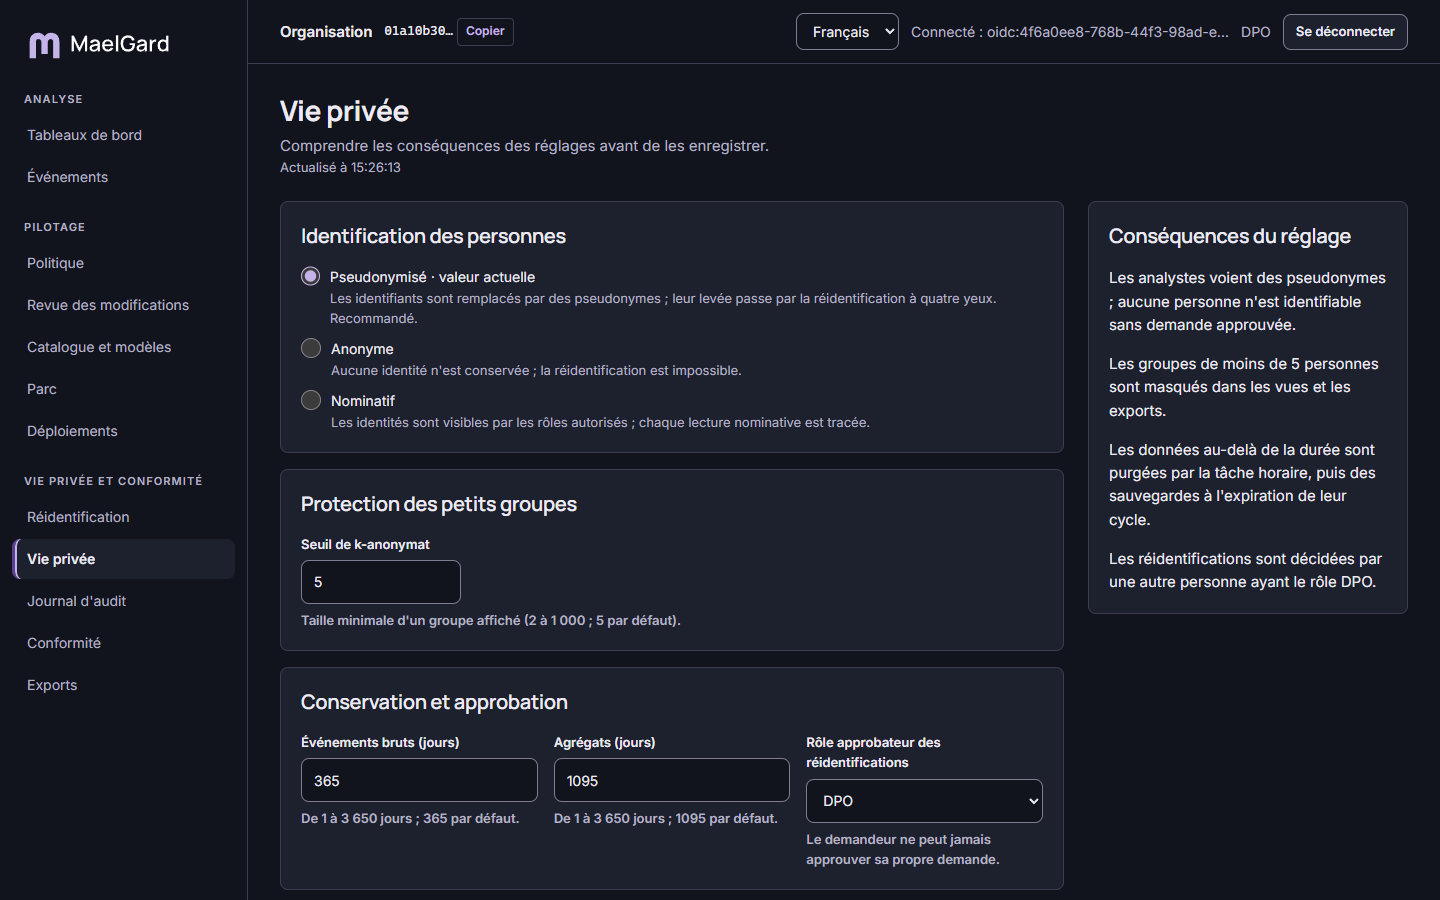
Settings editable by the DPO only; other roles read them. Each setting shows its consequences before saving.
| Setting | Values | Effect |
|---|---|---|
| Identification level | Pseudonymised (recommended), Anonymous, Named | Pseudonymised: pseudonyms, lift via re-identification. Anonymous: no identity kept, re-identification impossible. Named: identities visible to authorised roles, each read traced. Switching to named requires confirmation. |
| k-anonymity threshold | 2 to 1,000 (5 by default) | Smaller groups are masked in views and exports. |
| Raw event retention | 1 to 3,650 days (365 by default) | Hourly purge beyond, then from backups at the end of their cycle. |
| Aggregate retention | 1 to 3,650 days (1,095 by default) | Same mechanism as raw events. |
| Re-identification approver role | DPO (default), tenant admin, security admin, analyst or auditor | Requests are decided by another person holding this role. |
"Discard changes" drops unsaved edits.
6.3 Audit log
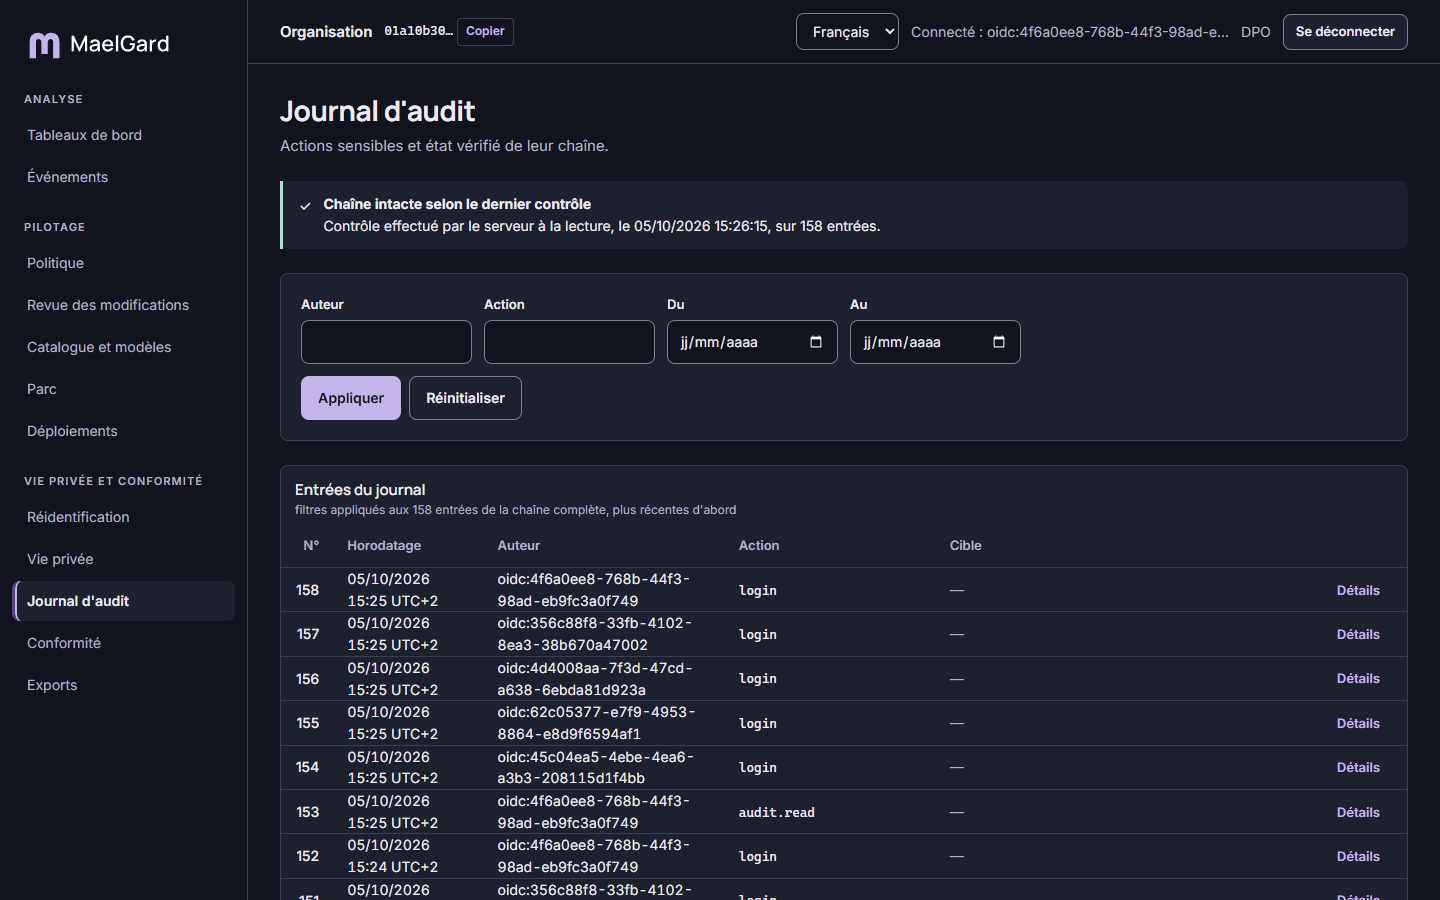
Read access for the DPO and the auditor. The banner at the top shows the integrity chain status verified by the server at read time:
- "Chain intact at last check", with the check date and the entry count;
- "Break detected", with the entry number. Entries remain readable; report the incident.
Filter by author, action and period. "Details" opens a full entry: timestamp, author, action, target and parameters. No entry can be edited or deleted.
6.4 Compliance
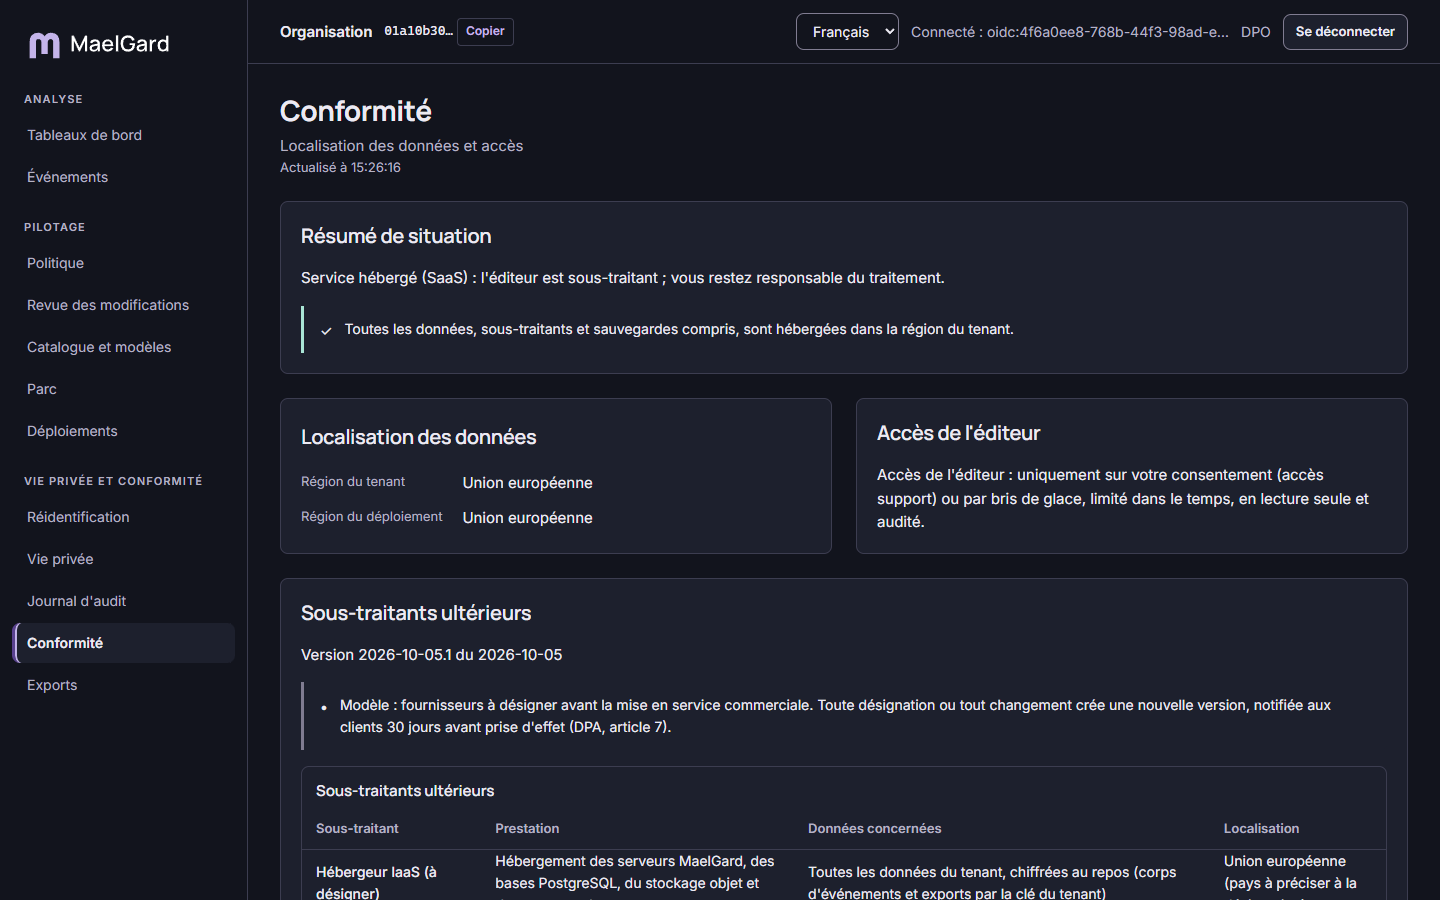
Factual reference, with no legal conclusion:
- deployment mode (hosted service or on-premises);
- tenant and deployment regions;
- vendor access conditions;
- in SaaS, versioned list of subprocessors (service, data concerned, location) and history of changes.
A banner flags any subprocessor outside the tenant region.
6.5 Exports
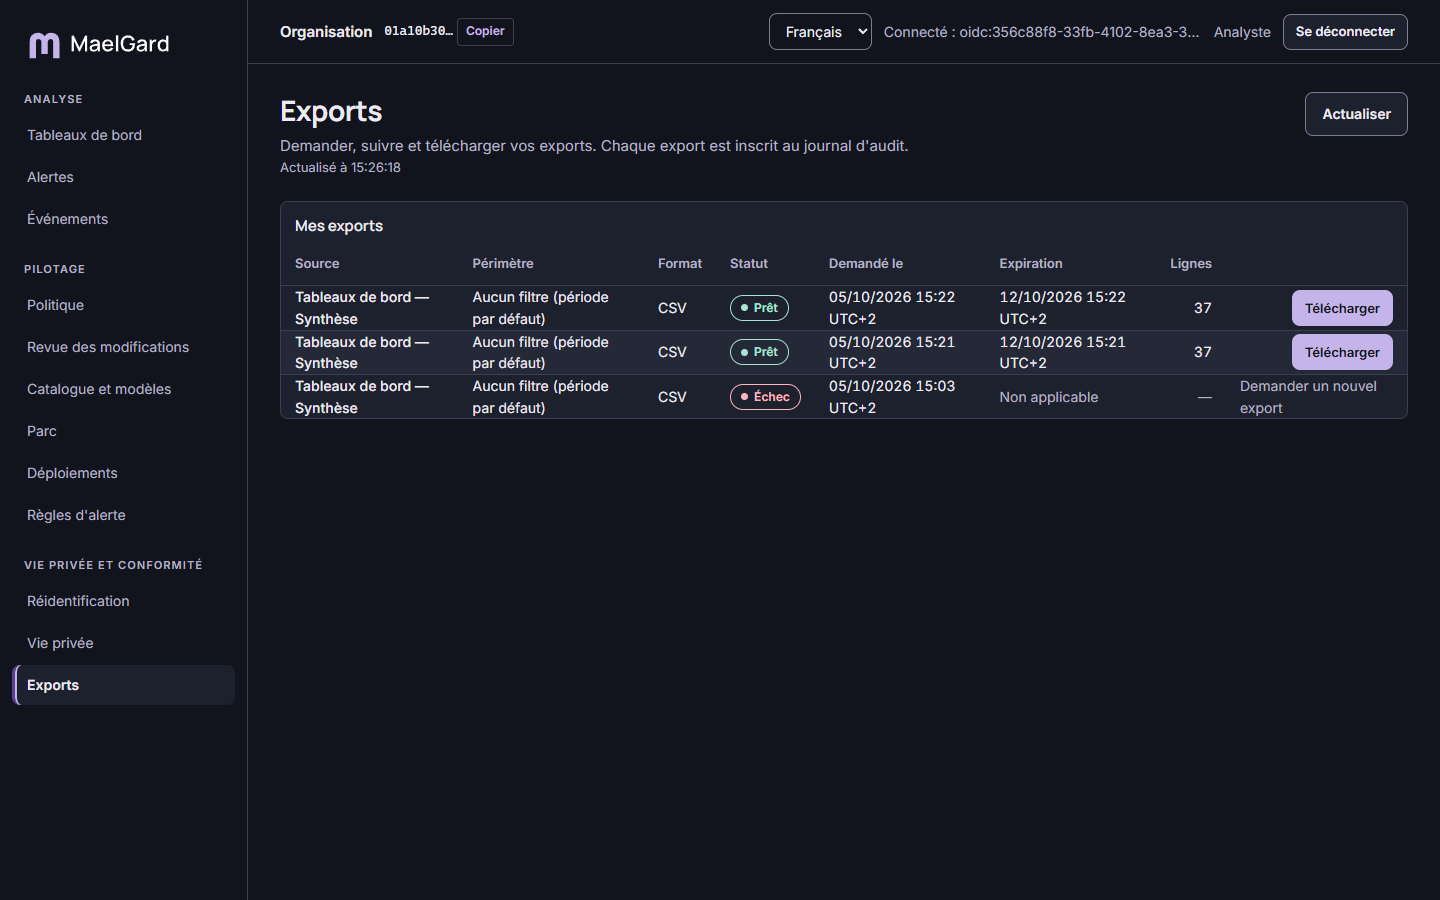
Request (analyst, DPO): "Request export" button from a dashboard or event search. Choose CSV or PDF and enter a reason. The export applies the same protections as the view (small groups masked, permissions).
Track, "Exports" screen: your exports only, with their status (preparing, ready, failed, expired). "Refresh" updates the list. "Download" retrieves a ready export. An export remains available for 7 days.
7. Pilot
7.1 Policy
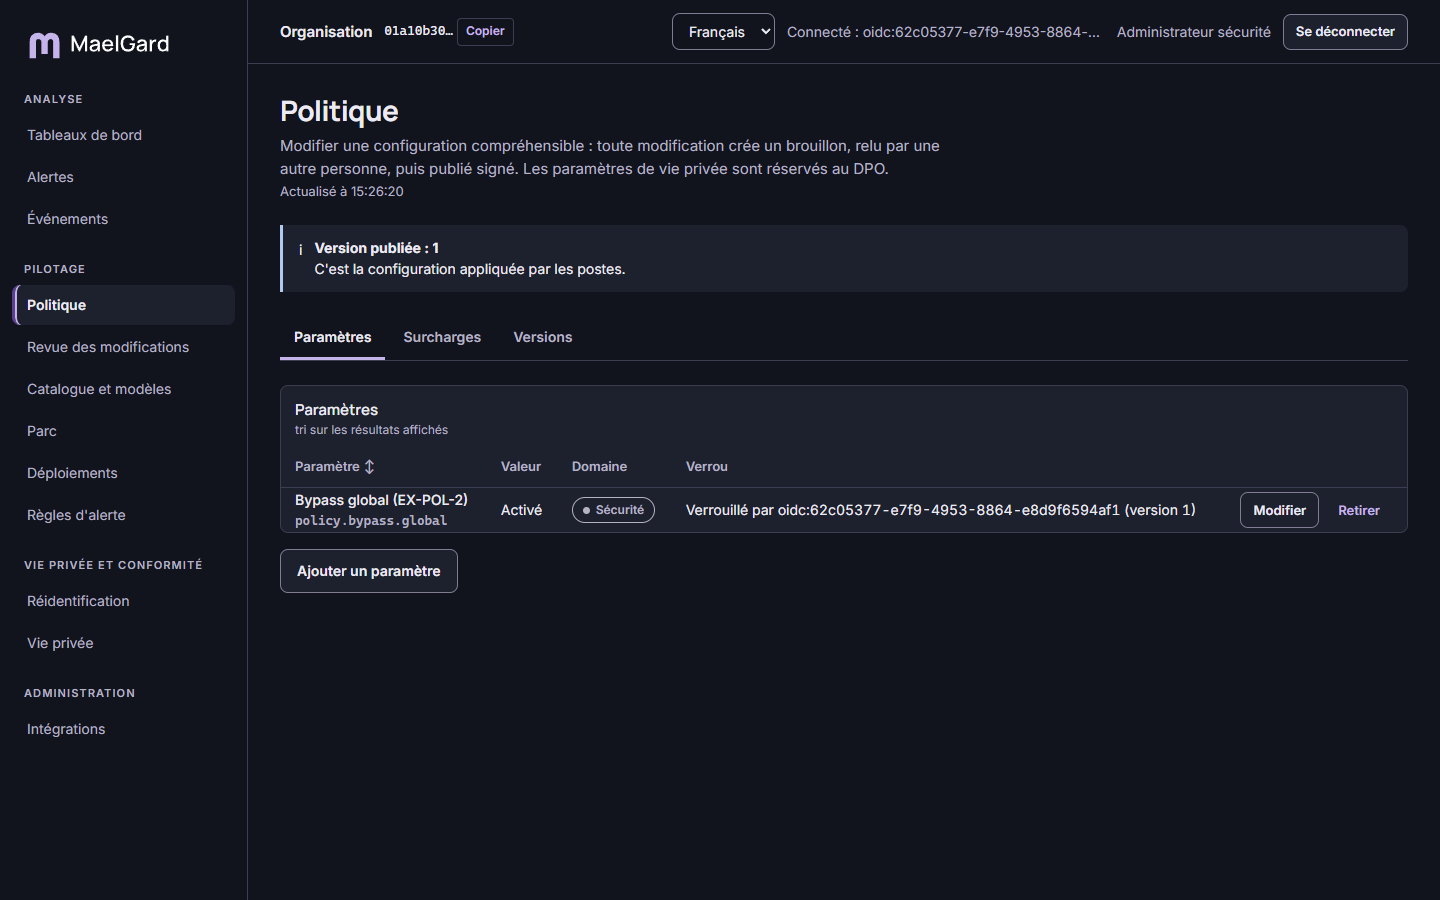
The policy is the configuration applied by agents on devices. The screen shows the published version: parameters per section (channels, interception, data categories, usage rules, analysis, device UI), overrides, version history. Without a defined parameter, the vendor defaults apply.
Edit (security admin, and DPO for privacy settings):
- "Edit" or "Add parameter". The form adapts to the value type. The "Technical mode (JSON)" is reserved for uncovered cases.
- Lock: a locked parameter cannot be changed by an override.
- Overrides: they adapt parameters for a device group, a user group, a channel or a service. The most specific wins: service, then channel, user group and device group.
- "Save draft": differences with the published version are shown. Saving applies nothing. The draft then goes through review.
Roll back: "Revert to this version" on a past version creates a draft, which also goes through review.
7.2 Change review
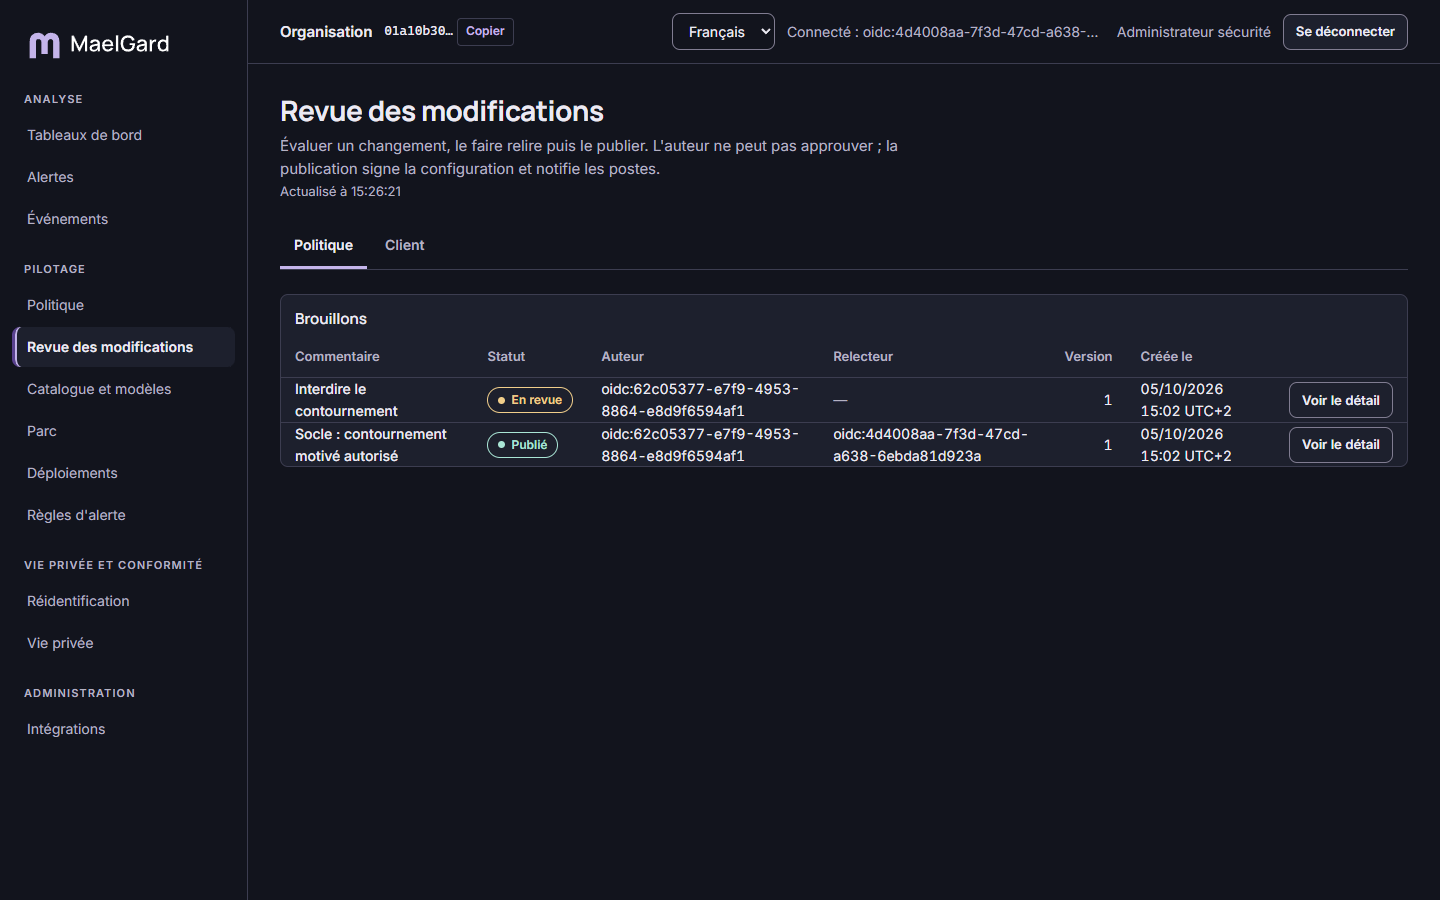
Draft cycle: Draft → In review → Approved → Published, or Rejected. Two tabs: "Policy" and "Client" (client catalog).
- Simulate (optional, recommended): number of devices and people affected, resulting configuration. You can also test fictional text: the server shows the applied action and the obfuscated text. Simulating does not approve or publish.
- Submit for review (author): the draft is no longer editable.
- Approve or Reject by someone other than the author. The reason for a rejection is sent to the author. The reviewer must hold the role matching the content.
- Publish by a person with the required role. The configuration is signed and notified to the relevant devices.
7.3 Catalog and models
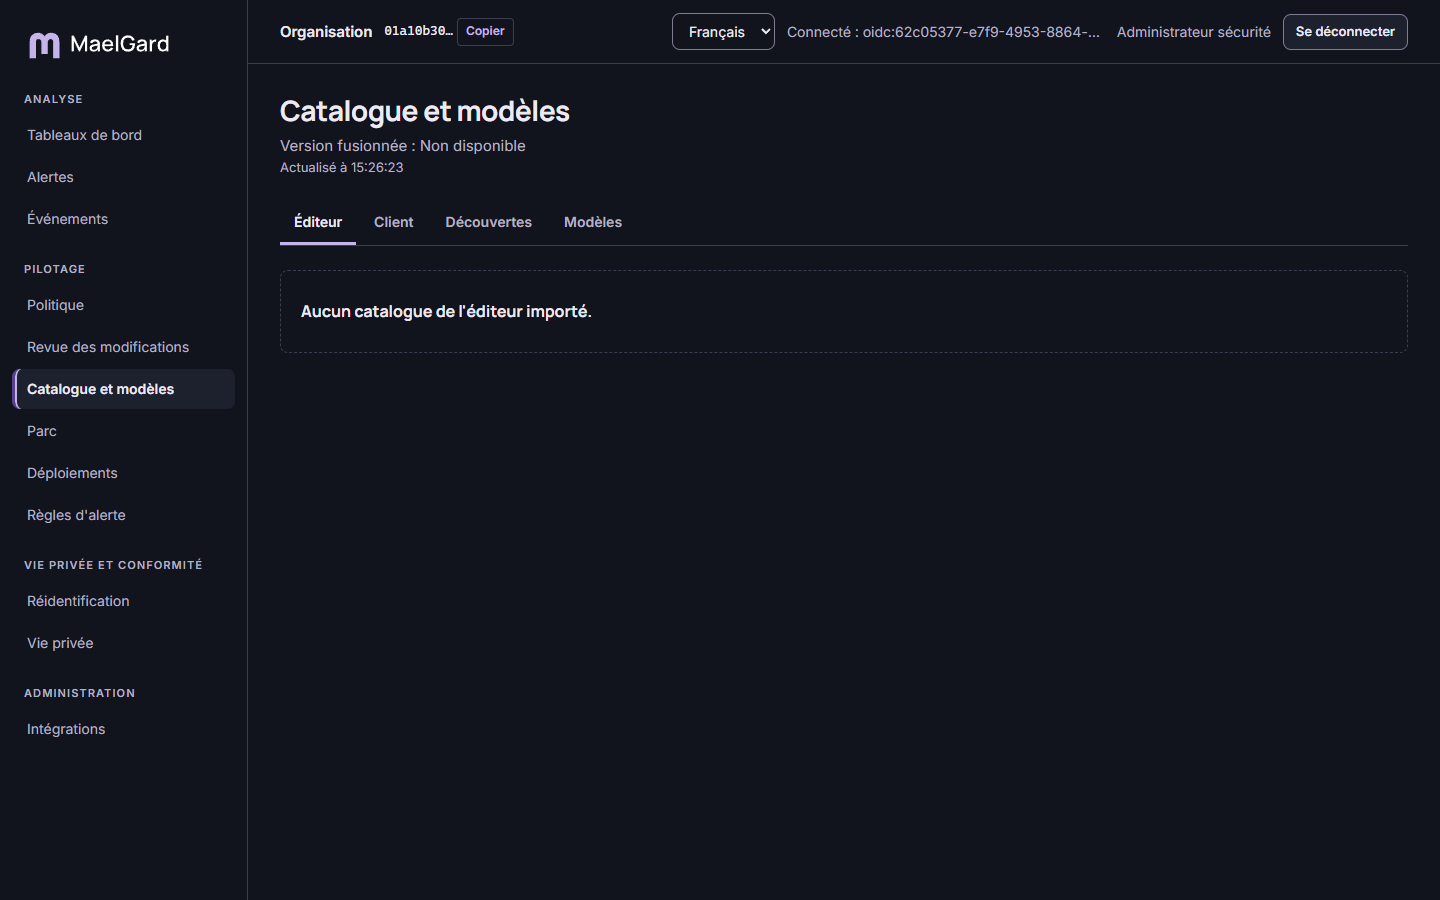
Four tabs structure the view.
- Vendor: AI services recognised by agents, provided by the vendor, read-only.
- Client: services added by your organisation (internal tool, unreferenced service). The security admin adds or edits a service by declaring identifier, channels, domains, endpoint path (optional), JSONPath extraction paths and minimum agent version. The client catalog goes through review like the policy.
- Discoveries: unknown AI domains reported by devices, without any link to a device or person. An unknown domain is not presumed malicious. "Mark as added" only classifies the discovery: the service is active only once added to the client catalog and published. "Ignore" discards it.
- Models: detection models in the catalog (language, size, version). A listed model is not necessarily loaded by every device.
7.4 Fleet
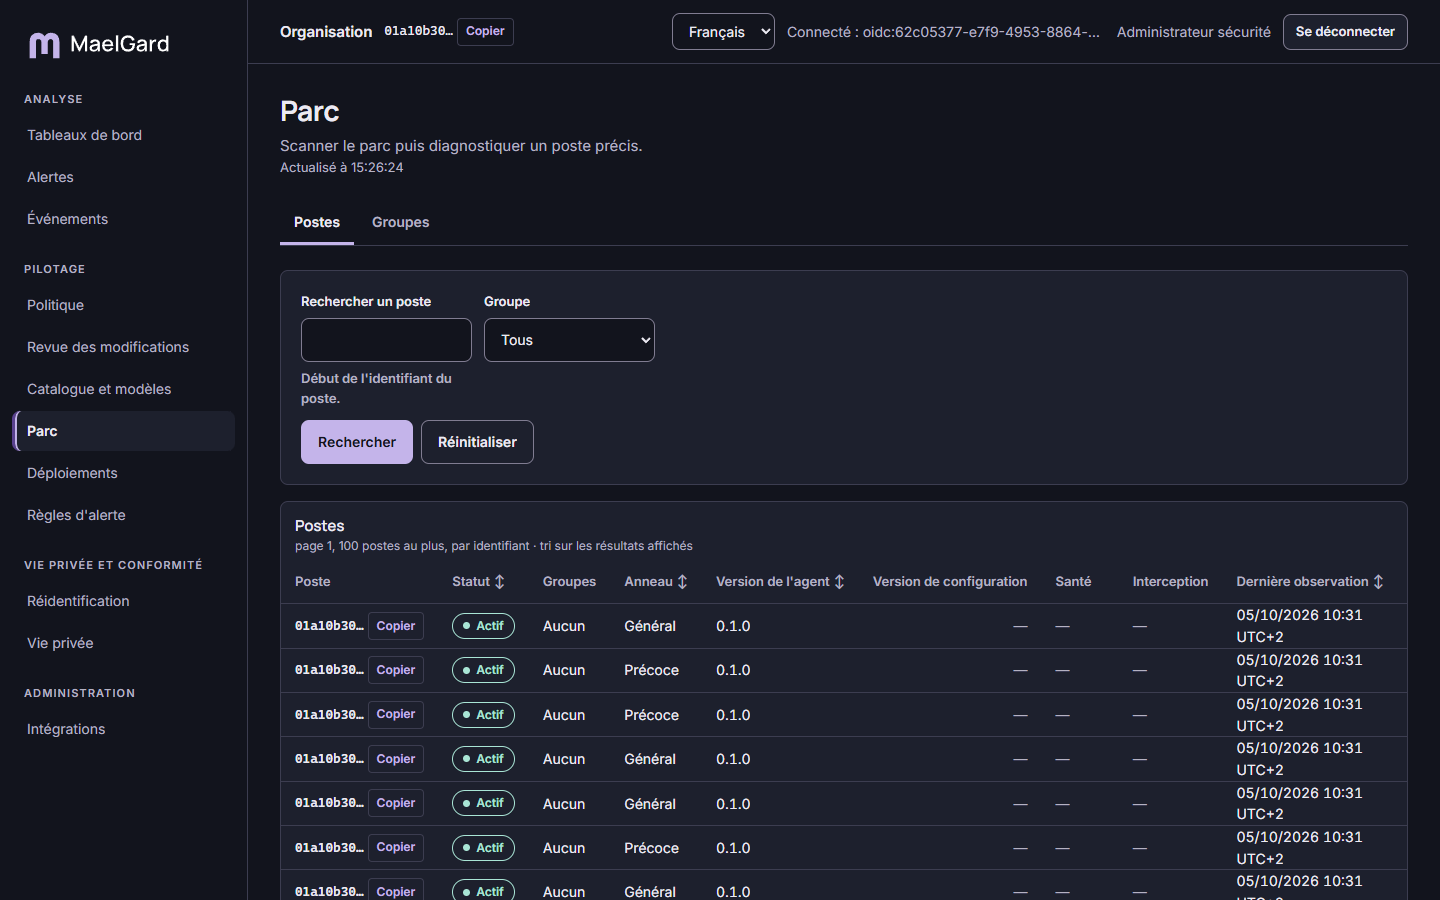
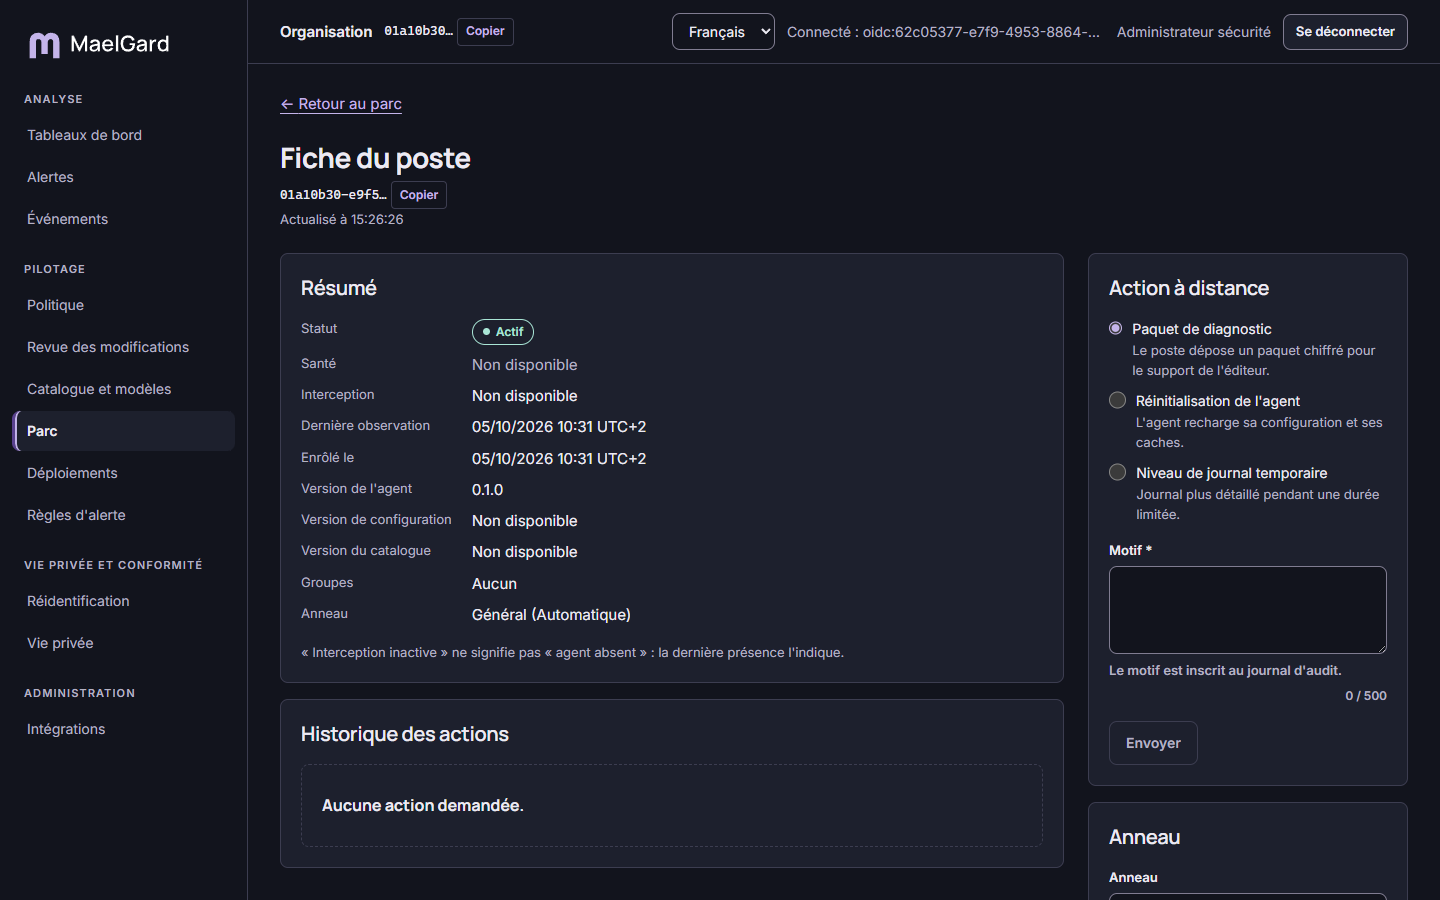
Devices tab: status, groups, ring, agent and config versions, health, interception and last seen. Search targets the start of the device identifier; the filter targets a group.
Device page (click on a device):
- Summary: enrolment, versions, health, catalog. "Interception inactive" does not mean "agent missing": last seen tells.
- Ring (security admin): automatic, derived from rollout percentages, or forced.
- Remote actions (device operator, admins): "Diagnostic bundle" (encrypted bundle for support), "Agent reset" (reload config and caches), "Temporary log level" (1 to 1,440 minutes). History shows "Requested" then "Delivered to device". The device does not send the action result.
- Revoke device: the device can no longer report events or receive configuration. Irreversible: it must be re-enrolled.
Groups tab: manual groups and directory groups, with their devices. Tenant and security admins create manual groups and add devices. Directory groups follow the directory.
7.5 Rollouts
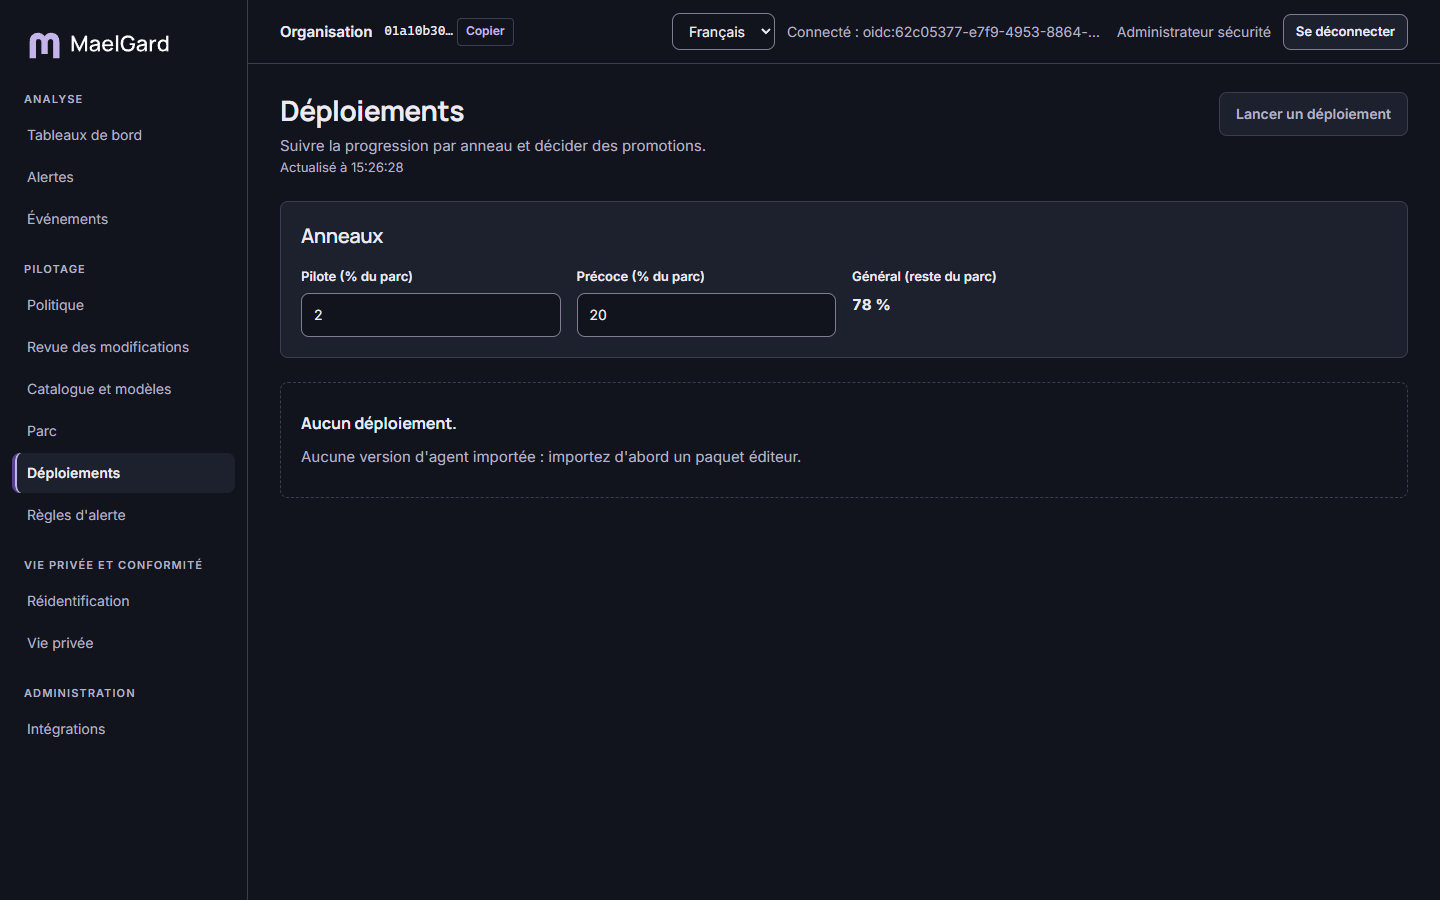
Progressive agent updates by rings: Pilot, Early, then General (the rest of the fleet). Percentages for the first two are adjustable; their sum must not exceed 100. The security admin drives, other roles read.
- Start a rollout: choose an agent version imported from a vendor bundle. Automatic promotion or not: with automatic promotion, moving to the next ring occurs when the success threshold is reached.
- Tracking: for each ring, reached or not, and "x of n devices up to date", with failures.
- Promote, Resume, Cancel: a reason is required to resume or cancel. A cancellation does not roll back already updated devices.
- Rollout blocked: the cause appears in the matching alert (link "View Rollout blocked alerts").
7.6 Alert rules
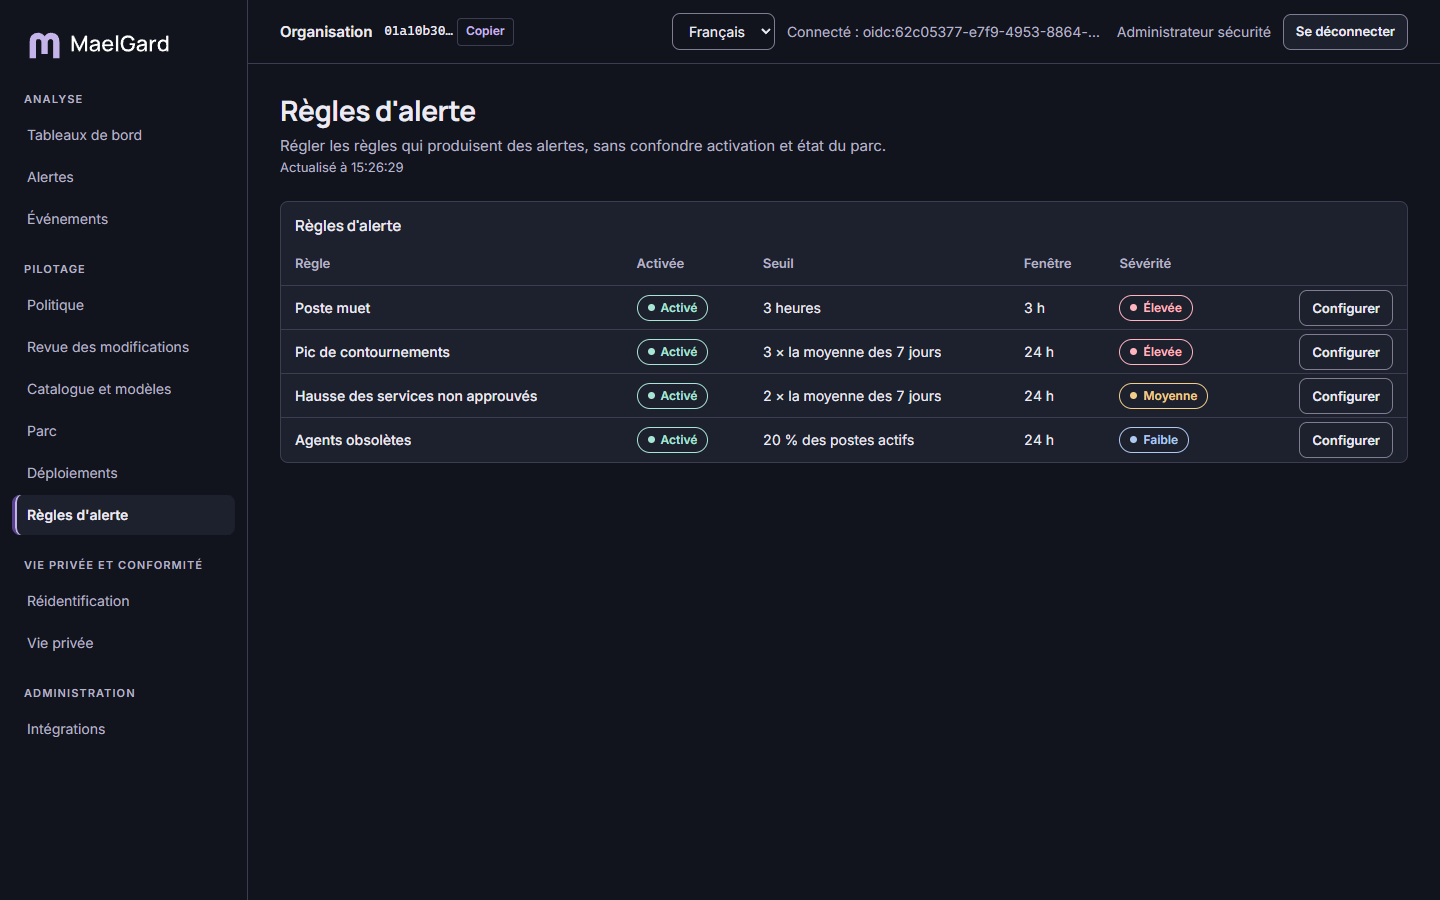
Four tunable rules feed the alert queue and configured destinations.
| Rule | Threshold | Example |
|---|---|---|
| Silent device | silence duration (hours) | 3 hours |
| Bypass spike | factor × 7-day average | 3 = three times the average |
| Rise in unapproved services | factor × 7-day average | 2 |
| Stale agents | % of active devices not on the latest version | 20% |
"Configure" sets enablement, threshold, observation window (1 to 720 hours) and severity. Disabling a rule requires confirmation. Produced alerts are sent to the destinations configured in Integrations, based on their severity.
7.7 Device enrolment
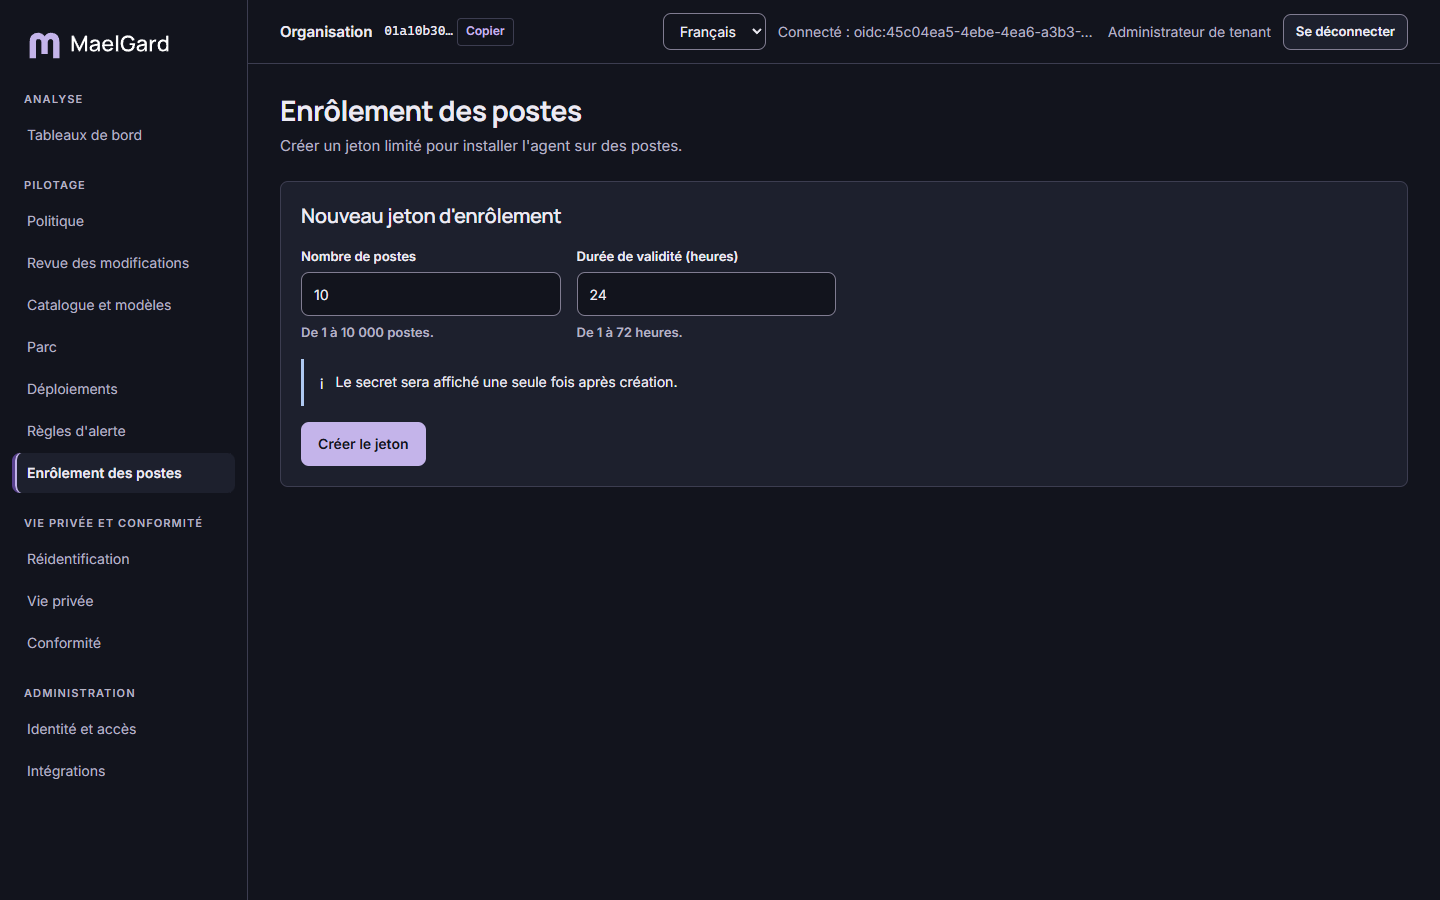
The tenant admin and the device operator create an enrolment token to install the agent. The token is valid for 1 to 10,000 devices, during 1 to 72 hours.
8. Administration
8.1 Identity and access
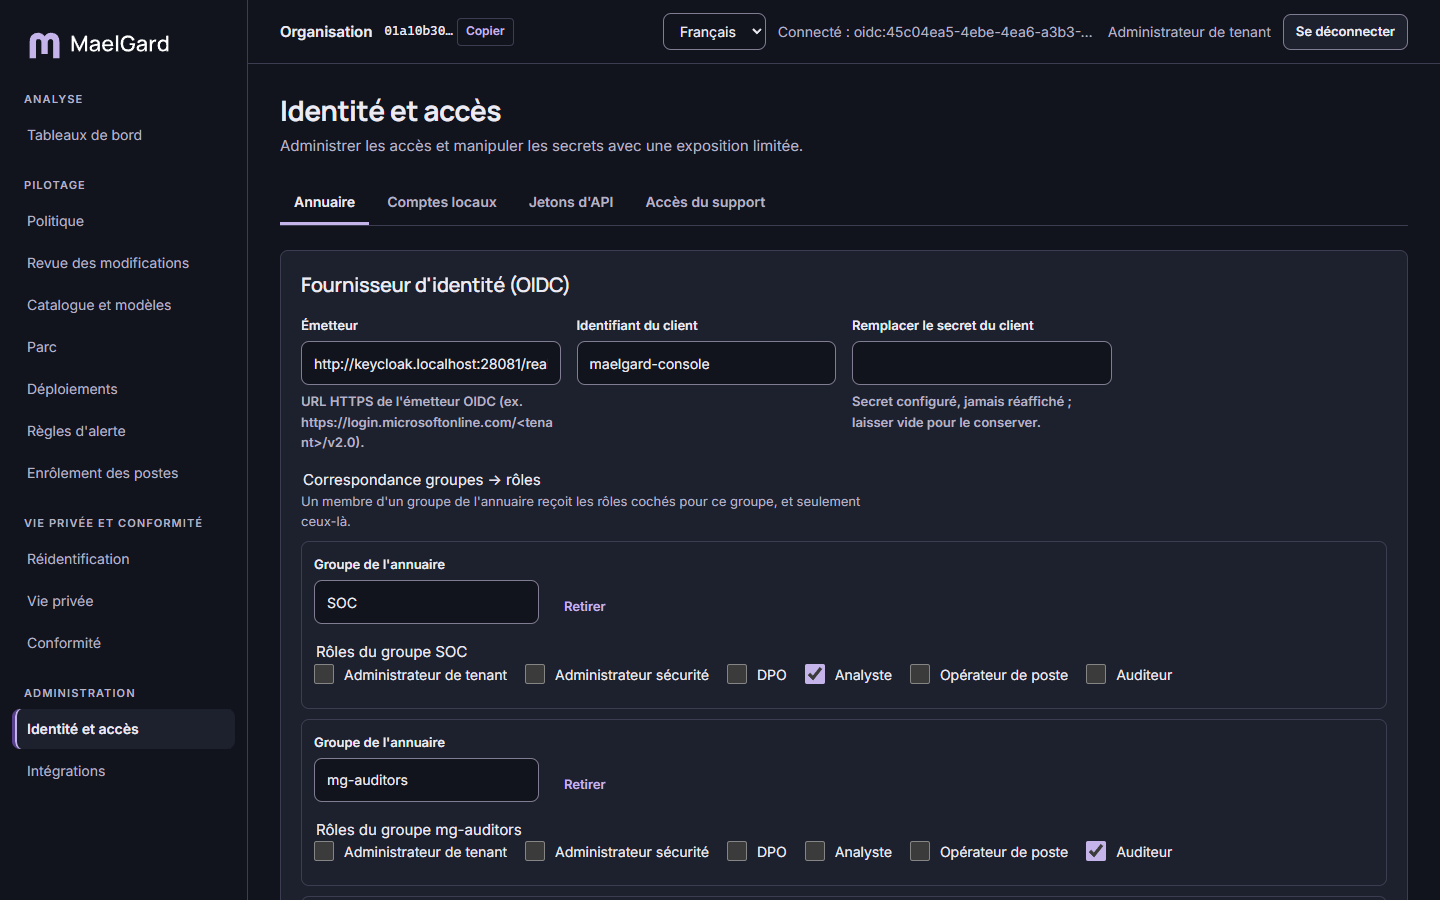
The tenant admin edits. The auditor reads metadata, with no secrets.
- Directory: OIDC identity provider of the organisation (HTTPS issuer, client ID, client secret never shown again), group-to-role mapping (for each group, tick the roles; a member receives their groups' roles and only those), "Require strong authentication" (sign-in is refused if the provider does not attest multi-factor authentication).
- Local accounts (installations without directory): creation with a password of at least 12 characters and roles. The authenticator app link is shown once: register it in the person's app immediately. "Disable" closes current sessions, "Re-enable" restores access.
- API tokens: a token gives a tool (SIEM, script) API access limited to its roles, for 1 to 366 days. The secret is shown once. Revocation is final.
- Support access (SaaS): grant a vendor operator read-only access, limited to 4 hours and audited. A break-glass raises an alert and can be stopped at any time. On-premises, the vendor has no access.
8.2 Integrations
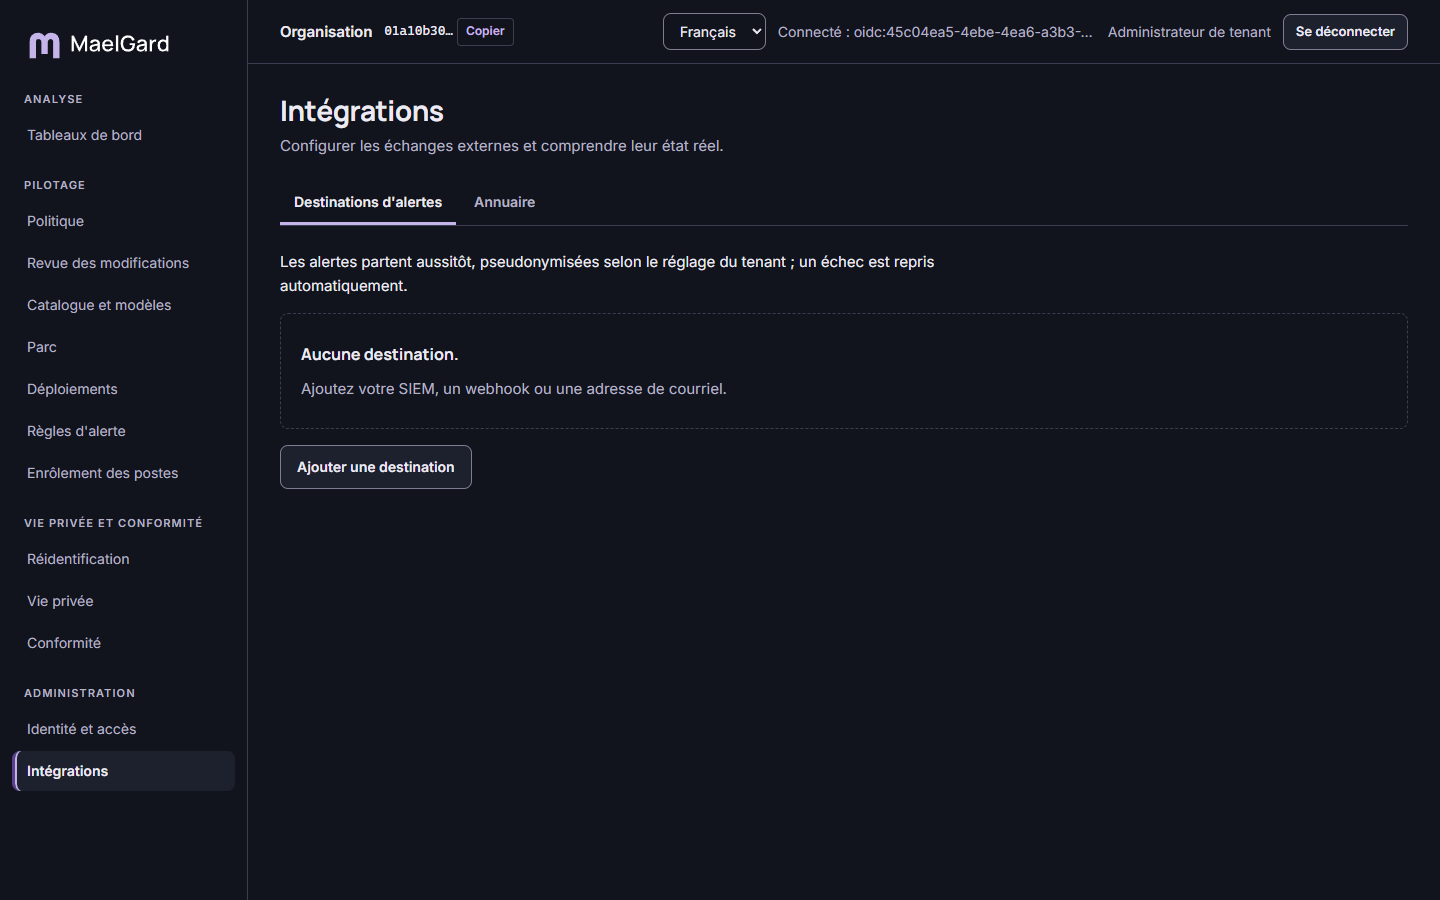
The tenant admin configures. The security admin and the auditor read.
- Alert destinations: Syslog TLS, Splunk HEC, Microsoft Sentinel, signed webhook, email. Each destination has a minimum severity and can also receive the audit log. Alerts are sent immediately, pseudonymised per tenant setting; a failure is retried automatically. Each destination state is shown (last successful send, error, pending sends, untested). "Send test" sends a real message with synthetic content. Removing a destination drops its pending sends.
- Directory: Microsoft Graph or LDAP connector (
ldaps://, orldap://with StartTLS) and sync interval (5 to 1,440 minutes). "Sync now" launches an immediate sync. Synced groups are used to target policy overrides. A group removed from the directory raises an alert. "Remove targeting" makes overrides targeting it stop applying; no device is deleted.
9. Vendor console (SaaS)
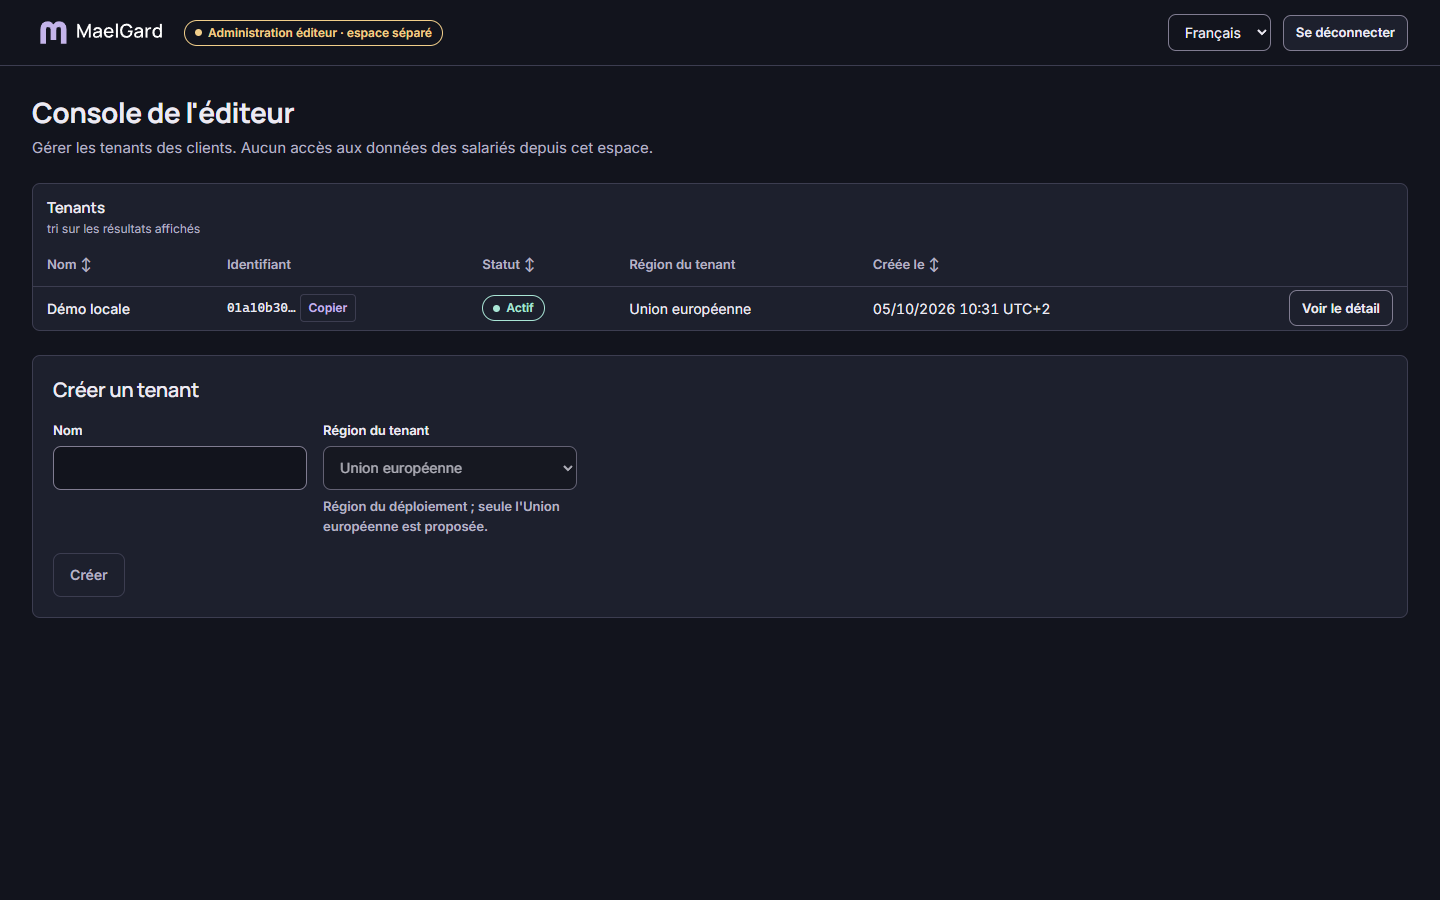
Separate space, reserved for vendor operators, at the /vendor path of the console. It is not accessible to client accounts and gives no access to any employee data.
- Sign-in: "Sign in (operator)", via the vendor directory.
- Tenants: list (name, identifier, status, region, creation date) and creation. Creation provisions keys and the certificate authority. Only the European Union is offered as a region.
- Suspend / Resume: a suspended tenant has devices refused and connections closed; its data is retained.
- Delete tenant: enter the exact tenant name and a reason. Keys are destroyed immediately: data becomes unreadable, backups included. Data is then purged. The signed deletion certificate appears only once the purge is complete. Irreversible.
10. Common messages and situations
| Message | What to do |
|---|---|
| "You do not have the required permissions for this action." | Your role does not allow it. Ask the tenant admin to review the group-to-role mapping. |
| "Your session has expired. Please sign in again." | Sign in again. Unsaved changes are lost. |
| "The item changed in the meantime. Reload and try again." | Another person changed the item. Reload the page before trying again. |
| "The action could not be confirmed. Check its state before retrying." | The server did not confirm. Reload and check whether the action was recorded before retrying. |
| "Data unavailable" | "Retry". If the error persists, notify the operator. |
| "Unit masked for n events on this page" | Those events' unit has fewer than k people: it is masked, events remain listed. |
| "No data for this period with these filters." | Widen the period or remove filters. |
| "Masked" value | Group of fewer than k people, masked to protect people. |
| "Not computable" | Rate with no denominator over the period (e.g. no entity detected). |
| "Delivered to device — result not reported" | The action was delivered to the device, which does not send back the result. Check its effect on the device page (versions, health, last seen). |
11. Glossary
- Tenant: a client organisation's space; its data is isolated from others.
- Agent: software installed on devices that analyses AI service usage.
- Entity: detected sensitive data (address, IBAN, source code), classified by category.
- Obfuscation: replacement of sensitive data before it reaches the AI service.
- Bypass: a send kept in spite of protection, with a reason given by the user.
- Pseudonym: replacement identifier for a person. Only an approved re-identification allows matching with an identity.
- k-anonymity: threshold below which a group is not shown.
- Override: policy variant for a group, a channel or a service.
- Ring: agent-version rollout wave (Pilot, Early, General).
- Break-glass: vendor emergency access without prior consent, limited, audited and flagged by an alert.